Alfalfa latent virus
Taxonomy: Viruses; Riboviria; Orthornavirae; Kitrinoviricota; Alsuviricetes; Tymovirales; Betaflexiviridae; Quinvirinae; Carlavirus; Pea streak virus
Average proteome isoelectric point is 6.33
Get precalculated fractions of proteins
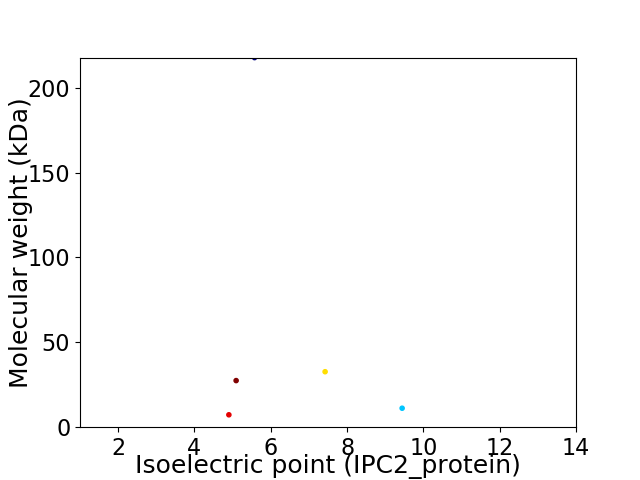
Virtual 2D-PAGE plot for 5 proteins (isoelectric point calculated using IPC2_protein)
Get csv file with sequences according to given criteria:
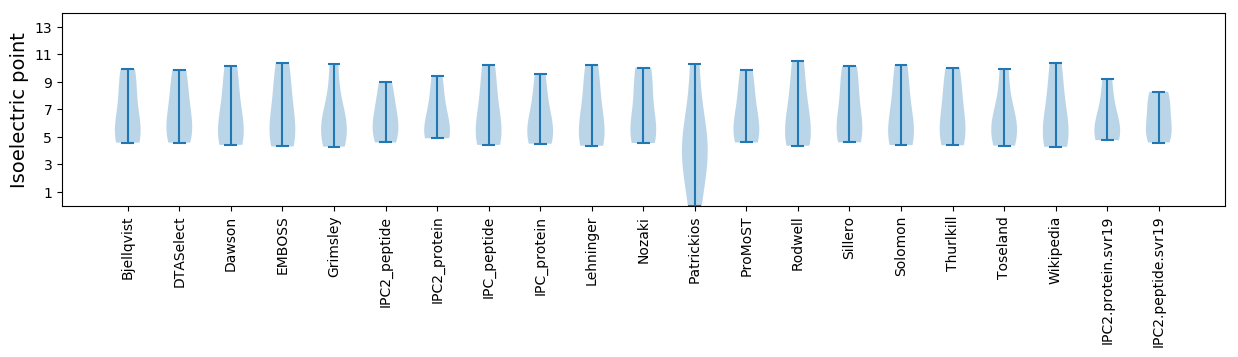
* You can choose from 21 different methods for calculating isoelectric point
Summary statistics related to proteome-wise predictions
Protein with the lowest isoelectric point:
>tr|A0A0C5H7M3|A0A0C5H7M3_9VIRU Helicase OS=Alfalfa latent virus OX=165250 PE=3 SV=1
MM1 pKa = 7.47QLFQVILSVFSCCAVLLCLYY21 pKa = 10.07TIDD24 pKa = 4.58SFLNNSVCQCTVVLTGEE41 pKa = 4.12SVKK44 pKa = 10.54IVGCEE49 pKa = 3.77FTSEE53 pKa = 4.24FIEE56 pKa = 4.26YY57 pKa = 10.66AKK59 pKa = 9.63TLKK62 pKa = 10.35VQAII66 pKa = 4.02
MM1 pKa = 7.47QLFQVILSVFSCCAVLLCLYY21 pKa = 10.07TIDD24 pKa = 4.58SFLNNSVCQCTVVLTGEE41 pKa = 4.12SVKK44 pKa = 10.54IVGCEE49 pKa = 3.77FTSEE53 pKa = 4.24FIEE56 pKa = 4.26YY57 pKa = 10.66AKK59 pKa = 9.63TLKK62 pKa = 10.35VQAII66 pKa = 4.02
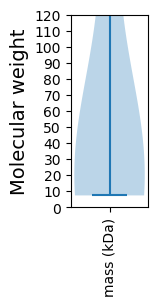
Molecular weight: 7.31 kDa
Isoelectric point according different methods:
Protein with the highest isoelectric point:
>tr|Q913Z7|Q913Z7_9VIRU Movement protein TGB2 OS=Alfalfa latent virus OX=165250 PE=3 SV=1
MM1 pKa = 7.61PLIAPPNNSNSYY13 pKa = 9.8LALAIGAGFAIIIFTLRR30 pKa = 11.84SNQLPHH36 pKa = 7.87VGDD39 pKa = 4.79NIHH42 pKa = 6.42SLPHH46 pKa = 5.56GGFYY50 pKa = 10.28RR51 pKa = 11.84DD52 pKa = 3.42GTKK55 pKa = 10.29VIQYY59 pKa = 8.2NSPVRR64 pKa = 11.84TPNNWFKK71 pKa = 11.32GPNNIQALALVLLVIGLIHH90 pKa = 6.83ASSVKK95 pKa = 9.98ISRR98 pKa = 11.84GCSCSKK104 pKa = 10.9
MM1 pKa = 7.61PLIAPPNNSNSYY13 pKa = 9.8LALAIGAGFAIIIFTLRR30 pKa = 11.84SNQLPHH36 pKa = 7.87VGDD39 pKa = 4.79NIHH42 pKa = 6.42SLPHH46 pKa = 5.56GGFYY50 pKa = 10.28RR51 pKa = 11.84DD52 pKa = 3.42GTKK55 pKa = 10.29VIQYY59 pKa = 8.2NSPVRR64 pKa = 11.84TPNNWFKK71 pKa = 11.32GPNNIQALALVLLVIGLIHH90 pKa = 6.83ASSVKK95 pKa = 9.98ISRR98 pKa = 11.84GCSCSKK104 pKa = 10.9
Molecular weight: 11.18 kDa
Isoelectric point according different methods:
Peptides (in silico digests for buttom-up proteomics)
Below you can find in silico digests of the whole proteome with Trypsin, Chymotrypsin, Trypsin+LysC, LysN, ArgC proteases suitable for different mass spec machines.| Try ESI |
 |
|---|
| ChTry ESI |
|
|---|
| ArgC ESI |
|
|---|
| LysN ESI |
|
|---|
| TryLysC ESI |
|
|---|
| Try MALDI |
|
|---|
| ChTry MALDI |
|
|---|
| ArgC MALDI |
|
|---|
| LysN MALDI |
|
|---|
| TryLysC MALDI |
|
|---|
| Try LTQ |
|
|---|
| ChTry LTQ |
|
|---|
| ArgC LTQ |
|
|---|
| LysN LTQ |
|
|---|
| TryLysC LTQ |
|
|---|
| Try MSlow |
|
|---|
| ChTry MSlow |
|
|---|
| ArgC MSlow |
|
|---|
| LysN MSlow |
|
|---|
| TryLysC MSlow |
|
|---|
| Try MShigh |
|
|---|
| ChTry MShigh |
|
|---|
| ArgC MShigh |
|
|---|
| LysN MShigh |
|
|---|
| TryLysC MShigh |
|
|---|
General Statistics
Number of major isoforms |
Number of additional isoforms |
Number of all proteins |
Number of amino acids |
Min. Seq. Length |
Max. Seq. Length |
Avg. Seq. Length |
Avg. Mol. Weight |
|---|---|---|---|---|---|---|---|
0 |
2616 |
66 |
1908 |
523.2 |
59.26 |
Amino acid frequency
Ala |
Cys |
Asp |
Glu |
Phe |
Gly |
His |
Ile |
Lys |
Leu |
|---|---|---|---|---|---|---|---|---|---|
6.766 ± 1.24 | 2.638 ± 0.389 |
5.505 ± 0.436 | 7.989 ± 0.968 |
5.81 ± 0.31 | 6.078 ± 0.266 |
2.332 ± 0.518 | 5.925 ± 0.637 |
6.46 ± 0.451 | 10.512 ± 1.29 |
Met |
Asn |
Gln |
Pro |
Arg |
Ser |
Thr |
Val |
Trp |
Tyr |
|---|---|---|---|---|---|---|---|---|---|
1.911 ± 0.276 | 4.472 ± 0.503 |
3.517 ± 0.664 | 3.058 ± 0.733 |
5.505 ± 0.395 | 7.148 ± 0.489 |
4.205 ± 0.413 | 6.078 ± 0.781 |
0.994 ± 0.241 | 3.096 ± 0.647 |
Most of the basic statistics you can see at this page can be downloaded from this CSV file
See this proteome in:

Proteome-pI is available under Creative Commons Attribution-NoDerivs license, for more details see here
| Reference: Kozlowski LP. Proteome-pI 2.0: Proteome Isoelectric Point Database Update. Nucleic Acids Res. 2021, doi: 10.1093/nar/gkab944 | Contact: Lukasz P. Kozlowski |