Bacillus phage PBP180
Taxonomy: Viruses; Duplodnaviria; Heunggongvirae; Uroviricota; Caudoviricetes; Caudovirales; Myoviridae; unclassified Myoviridae
Average proteome isoelectric point is 6.36
Get precalculated fractions of proteins
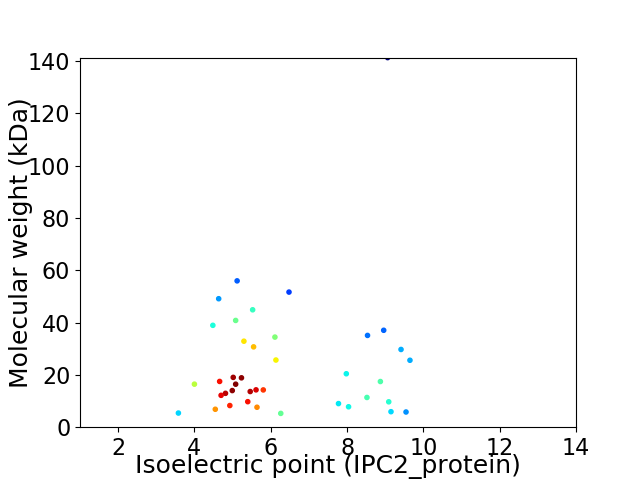
Virtual 2D-PAGE plot for 40 proteins (isoelectric point calculated using IPC2_protein)
Get csv file with sequences according to given criteria:
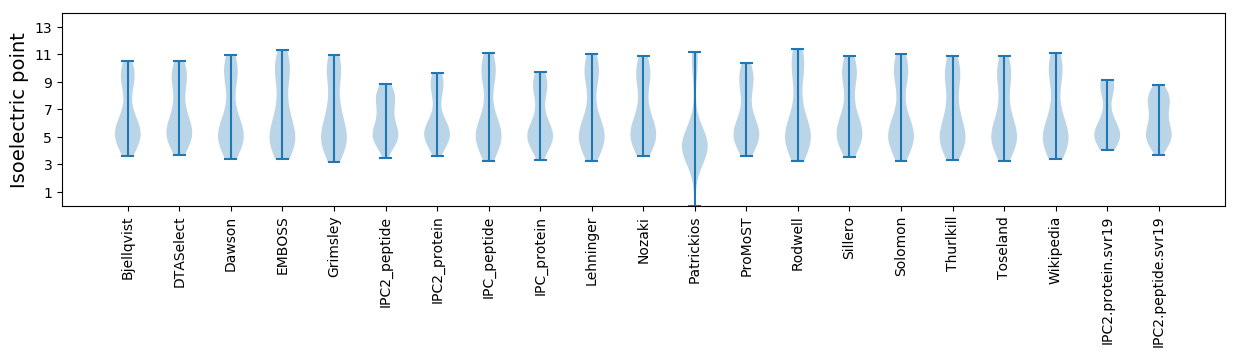
* You can choose from 21 different methods for calculating isoelectric point
Summary statistics related to proteome-wise predictions
Protein with the lowest isoelectric point:
>tr|R4JMS4|R4JMS4_9CAUD Uncharacterized protein OS=Bacillus phage PBP180 OX=2558359 GN=PBP180_005 PE=4 SV=1
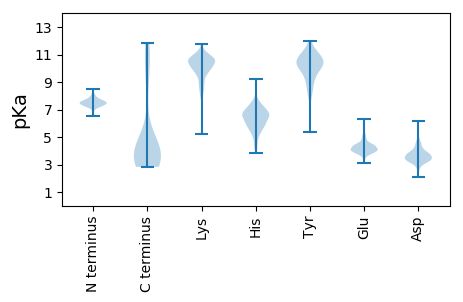
MM1 pKa = 7.43FPTVADD7 pKa = 4.17IKK9 pKa = 10.5QFWDD13 pKa = 3.45WQCYY17 pKa = 8.31GPEE20 pKa = 4.85DD21 pKa = 3.21IAFYY25 pKa = 11.25VSIGWISAEE34 pKa = 4.19DD35 pKa = 3.7YY36 pKa = 11.4QNITGEE42 pKa = 4.08IYY44 pKa = 10.29EE45 pKa = 4.2AA46 pKa = 4.39
MM1 pKa = 7.43FPTVADD7 pKa = 4.17IKK9 pKa = 10.5QFWDD13 pKa = 3.45WQCYY17 pKa = 8.31GPEE20 pKa = 4.85DD21 pKa = 3.21IAFYY25 pKa = 11.25VSIGWISAEE34 pKa = 4.19DD35 pKa = 3.7YY36 pKa = 11.4QNITGEE42 pKa = 4.08IYY44 pKa = 10.29EE45 pKa = 4.2AA46 pKa = 4.39
Molecular weight: 5.41 kDa
Isoelectric point according different methods:
Protein with the highest isoelectric point:
>tr|R4JHG4|R4JHG4_9CAUD Holin OS=Bacillus phage PBP180 OX=2558359 GN=PBP180_0039 PE=4 SV=1
MM1 pKa = 7.55LLKK4 pKa = 10.85LLGQIAGRR12 pKa = 11.84KK13 pKa = 9.04NEE15 pKa = 3.76FDD17 pKa = 3.59SVVFTIKK24 pKa = 10.35EE25 pKa = 4.22GNRR28 pKa = 11.84PMQSIHH34 pKa = 6.73FIGVASIIGKK44 pKa = 8.38GRR46 pKa = 11.84RR47 pKa = 11.84DD48 pKa = 3.38KK49 pKa = 11.42LILL52 pKa = 3.91
MM1 pKa = 7.55LLKK4 pKa = 10.85LLGQIAGRR12 pKa = 11.84KK13 pKa = 9.04NEE15 pKa = 3.76FDD17 pKa = 3.59SVVFTIKK24 pKa = 10.35EE25 pKa = 4.22GNRR28 pKa = 11.84PMQSIHH34 pKa = 6.73FIGVASIIGKK44 pKa = 8.38GRR46 pKa = 11.84RR47 pKa = 11.84DD48 pKa = 3.38KK49 pKa = 11.42LILL52 pKa = 3.91
Molecular weight: 5.81 kDa
Isoelectric point according different methods:
Peptides (in silico digests for buttom-up proteomics)
Below you can find in silico digests of the whole proteome with Trypsin, Chymotrypsin, Trypsin+LysC, LysN, ArgC proteases suitable for different mass spec machines.| Try ESI |
 |
|---|
| ChTry ESI |
|
|---|
| ArgC ESI |
|
|---|
| LysN ESI |
|
|---|
| TryLysC ESI |
|
|---|
| Try MALDI |
|
|---|
| ChTry MALDI |
|
|---|
| ArgC MALDI |
|
|---|
| LysN MALDI |
|
|---|
| TryLysC MALDI |
|
|---|
| Try LTQ |
|
|---|
| ChTry LTQ |
|
|---|
| ArgC LTQ |
|
|---|
| LysN LTQ |
|
|---|
| TryLysC LTQ |
|
|---|
| Try MSlow |
|
|---|
| ChTry MSlow |
|
|---|
| ArgC MSlow |
|
|---|
| LysN MSlow |
|
|---|
| TryLysC MSlow |
|
|---|
| Try MShigh |
|
|---|
| ChTry MShigh |
|
|---|
| ArgC MShigh |
|
|---|
| LysN MShigh |
|
|---|
| TryLysC MShigh |
|
|---|
General Statistics
Number of major isoforms |
Number of additional isoforms |
Number of all proteins |
Number of amino acids |
Min. Seq. Length |
Max. Seq. Length |
Avg. Seq. Length |
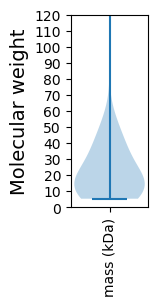
Avg. Mol. Weight |
|---|---|---|---|---|---|---|---|
0 |
8599 |
45 |
1288 |
215.0 |
24.35 |
Amino acid frequency
Ala |
Cys |
Asp |
Glu |
Phe |
Gly |
His |
Ile |
Lys |
Leu |
|---|---|---|---|---|---|---|---|---|---|
6.605 ± 0.344 | 0.454 ± 0.082 |
5.966 ± 0.408 | 7.396 ± 0.541 |
3.78 ± 0.281 | 6.687 ± 0.587 |
1.803 ± 0.275 | 6.419 ± 0.255 |
8.094 ± 0.436 | 8.257 ± 0.356 |
Met |
Asn |
Gln |
Pro |
Arg |
Ser |
Thr |
Val |
Trp |
Tyr |
|---|---|---|---|---|---|---|---|---|---|
2.838 ± 0.194 | 4.78 ± 0.391 |
3.419 ± 0.24 | 5.082 ± 0.341 |
4.733 ± 0.296 | 6.431 ± 0.498 |
6.233 ± 0.287 | 6.036 ± 0.404 |
1.582 ± 0.288 | 3.407 ± 0.415 |
Most of the basic statistics you can see at this page can be downloaded from this CSV file
See this proteome in:

Proteome-pI is available under Creative Commons Attribution-NoDerivs license, for more details see here
| Reference: Kozlowski LP. Proteome-pI 2.0: Proteome Isoelectric Point Database Update. Nucleic Acids Res. 2021, doi: 10.1093/nar/gkab944 | Contact: Lukasz P. Kozlowski |