Burkholderia sp. A9
Taxonomy: cellular organisms; Bacteria; Proteobacteria; Betaproteobacteria; Burkholderiales; Burkholderiaceae; Burkholderia; unclassified Burkholderia
Average proteome isoelectric point is 6.76
Get precalculated fractions of proteins
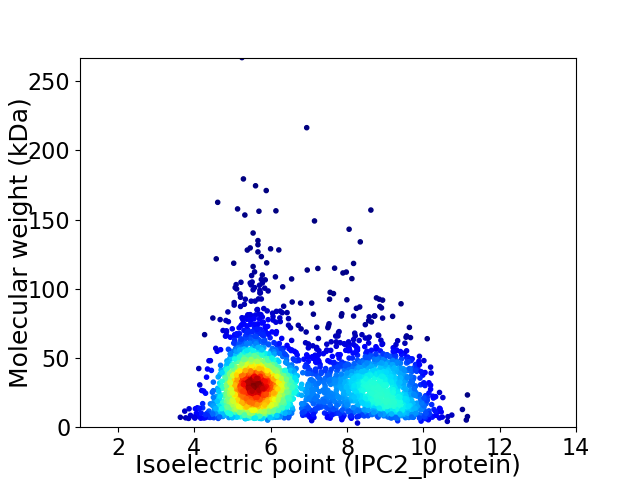
Virtual 2D-PAGE plot for 3010 proteins (isoelectric point calculated using IPC2_protein)
Get csv file with sequences according to given criteria:
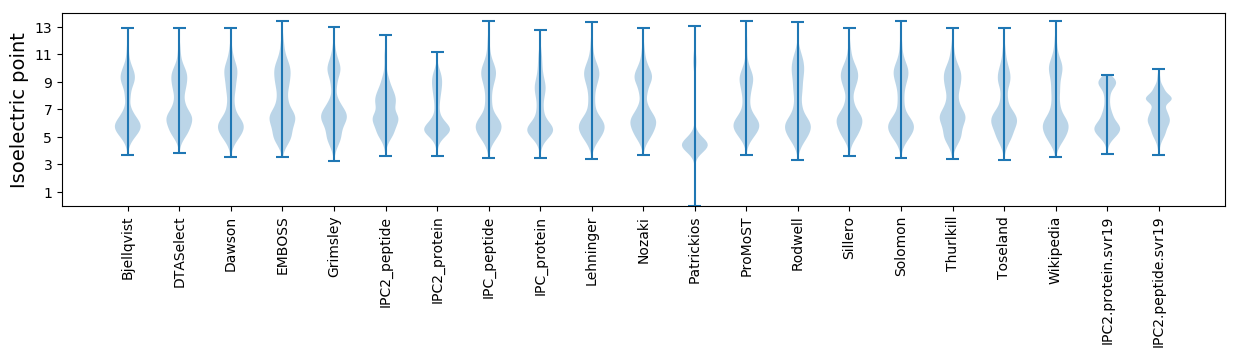
* You can choose from 21 different methods for calculating isoelectric point
Summary statistics related to proteome-wise predictions
Protein with the lowest isoelectric point:
>tr|A0A0B1YRV3|A0A0B1YRV3_9BURK Lysine transporter LysE OS=Burkholderia sp. A9 OX=1365108 GN=PI86_07385 PE=4 SV=1
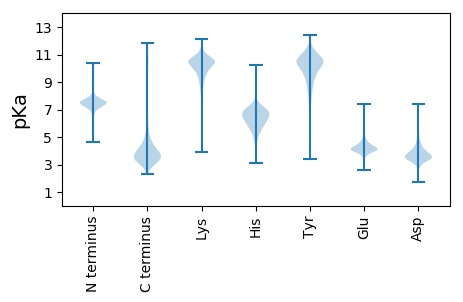
MM1 pKa = 7.57EE2 pKa = 5.15FKK4 pKa = 10.6LWQCVLCGFVYY15 pKa = 10.69DD16 pKa = 4.44EE17 pKa = 4.96AEE19 pKa = 4.08GMPAEE24 pKa = 5.47GIPAGTRR31 pKa = 11.84WADD34 pKa = 3.62VPDD37 pKa = 4.17DD38 pKa = 4.93WICPEE43 pKa = 4.34CSATKK48 pKa = 9.78IDD50 pKa = 4.29FEE52 pKa = 4.56MIEE55 pKa = 3.92II56 pKa = 4.27
MM1 pKa = 7.57EE2 pKa = 5.15FKK4 pKa = 10.6LWQCVLCGFVYY15 pKa = 10.69DD16 pKa = 4.44EE17 pKa = 4.96AEE19 pKa = 4.08GMPAEE24 pKa = 5.47GIPAGTRR31 pKa = 11.84WADD34 pKa = 3.62VPDD37 pKa = 4.17DD38 pKa = 4.93WICPEE43 pKa = 4.34CSATKK48 pKa = 9.78IDD50 pKa = 4.29FEE52 pKa = 4.56MIEE55 pKa = 3.92II56 pKa = 4.27
Molecular weight: 6.36 kDa
Isoelectric point according different methods:
Protein with the highest isoelectric point:
>tr|A0A0B1YUC9|A0A0B1YUC9_9BURK NAD-dependent dehydratase OS=Burkholderia sp. A9 OX=1365108 GN=PI86_02470 PE=3 SV=1
MM1 pKa = 7.74RR2 pKa = 11.84APVGRR7 pKa = 11.84RR8 pKa = 11.84HH9 pKa = 5.6GRR11 pKa = 11.84TGRR14 pKa = 11.84RR15 pKa = 11.84MAHH18 pKa = 6.22RR19 pKa = 11.84PSGAGSPALSRR30 pKa = 11.84PASAKK35 pKa = 9.36RR36 pKa = 11.84RR37 pKa = 11.84RR38 pKa = 11.84VRR40 pKa = 11.84HH41 pKa = 5.08WPAPACLARR50 pKa = 11.84RR51 pKa = 11.84SPAPHH56 pKa = 6.17APFRR60 pKa = 11.84IRR62 pKa = 11.84TRR64 pKa = 11.84RR65 pKa = 11.84LTRR68 pKa = 3.48
MM1 pKa = 7.74RR2 pKa = 11.84APVGRR7 pKa = 11.84RR8 pKa = 11.84HH9 pKa = 5.6GRR11 pKa = 11.84TGRR14 pKa = 11.84RR15 pKa = 11.84MAHH18 pKa = 6.22RR19 pKa = 11.84PSGAGSPALSRR30 pKa = 11.84PASAKK35 pKa = 9.36RR36 pKa = 11.84RR37 pKa = 11.84RR38 pKa = 11.84VRR40 pKa = 11.84HH41 pKa = 5.08WPAPACLARR50 pKa = 11.84RR51 pKa = 11.84SPAPHH56 pKa = 6.17APFRR60 pKa = 11.84IRR62 pKa = 11.84TRR64 pKa = 11.84RR65 pKa = 11.84LTRR68 pKa = 3.48
Molecular weight: 7.69 kDa
Isoelectric point according different methods:
Peptides (in silico digests for buttom-up proteomics)
Below you can find in silico digests of the whole proteome with Trypsin, Chymotrypsin, Trypsin+LysC, LysN, ArgC proteases suitable for different mass spec machines.| Try ESI |
 |
|---|
| ChTry ESI |
|
|---|
| ArgC ESI |
|
|---|
| LysN ESI |
|
|---|
| TryLysC ESI |
|
|---|
| Try MALDI |
|
|---|
| ChTry MALDI |
|
|---|
| ArgC MALDI |
|
|---|
| LysN MALDI |
|
|---|
| TryLysC MALDI |
|
|---|
| Try LTQ |
|
|---|
| ChTry LTQ |
|
|---|
| ArgC LTQ |
|
|---|
| LysN LTQ |
|
|---|
| TryLysC LTQ |
|
|---|
| Try MSlow |
|
|---|
| ChTry MSlow |
|
|---|
| ArgC MSlow |
|
|---|
| LysN MSlow |
|
|---|
| TryLysC MSlow |
|
|---|
| Try MShigh |
|
|---|
| ChTry MShigh |
|
|---|
| ArgC MShigh |
|
|---|
| LysN MShigh |
|
|---|
| TryLysC MShigh |
|
|---|
General Statistics
Number of major isoforms |
Number of additional isoforms |
Number of all proteins |
Number of amino acids |
Min. Seq. Length |
Max. Seq. Length |
Avg. Seq. Length |
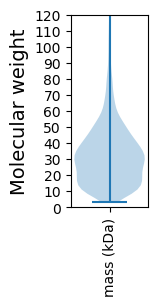
Avg. Mol. Weight |
|---|---|---|---|---|---|---|---|
0 |
940337 |
30 |
2517 |
312.4 |
33.83 |
Amino acid frequency
Ala |
Cys |
Asp |
Glu |
Phe |
Gly |
His |
Ile |
Lys |
Leu |
|---|---|---|---|---|---|---|---|---|---|
13.234 ± 0.075 | 0.914 ± 0.013 |
5.72 ± 0.037 | 4.843 ± 0.04 |
3.678 ± 0.03 | 8.314 ± 0.048 |
2.302 ± 0.022 | 4.587 ± 0.031 |
3.009 ± 0.04 | 10.146 ± 0.055 |
Met |
Asn |
Gln |
Pro |
Arg |
Ser |
Thr |
Val |
Trp |
Tyr |
|---|---|---|---|---|---|---|---|---|---|
2.346 ± 0.02 | 2.67 ± 0.031 |
5.121 ± 0.03 | 3.511 ± 0.027 |
7.111 ± 0.043 | 5.313 ± 0.031 |
5.465 ± 0.041 | 7.916 ± 0.035 |
1.36 ± 0.017 | 2.44 ± 0.026 |
Most of the basic statistics you can see at this page can be downloaded from this CSV file
See this proteome in:

Proteome-pI is available under Creative Commons Attribution-NoDerivs license, for more details see here
| Reference: Kozlowski LP. Proteome-pI 2.0: Proteome Isoelectric Point Database Update. Nucleic Acids Res. 2021, doi: 10.1093/nar/gkab944 | Contact: Lukasz P. Kozlowski |