Daphne virus S
Taxonomy: Viruses; Riboviria; Orthornavirae; Kitrinoviricota; Alsuviricetes; Tymovirales; Betaflexiviridae; Quinvirinae; Carlavirus
Average proteome isoelectric point is 6.83
Get precalculated fractions of proteins
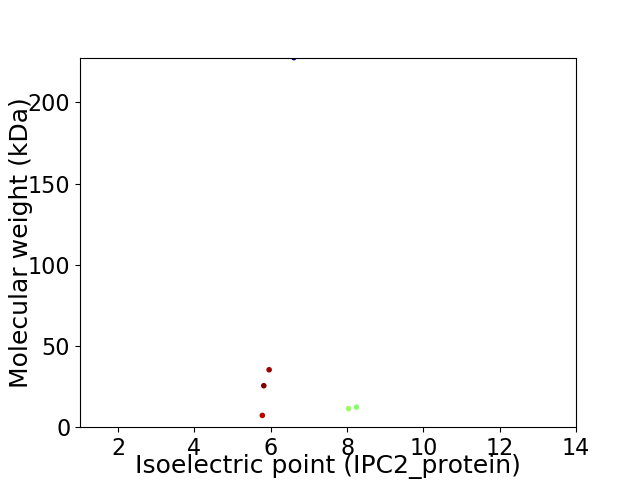
Virtual 2D-PAGE plot for 6 proteins (isoelectric point calculated using IPC2_protein)
Get csv file with sequences according to given criteria:
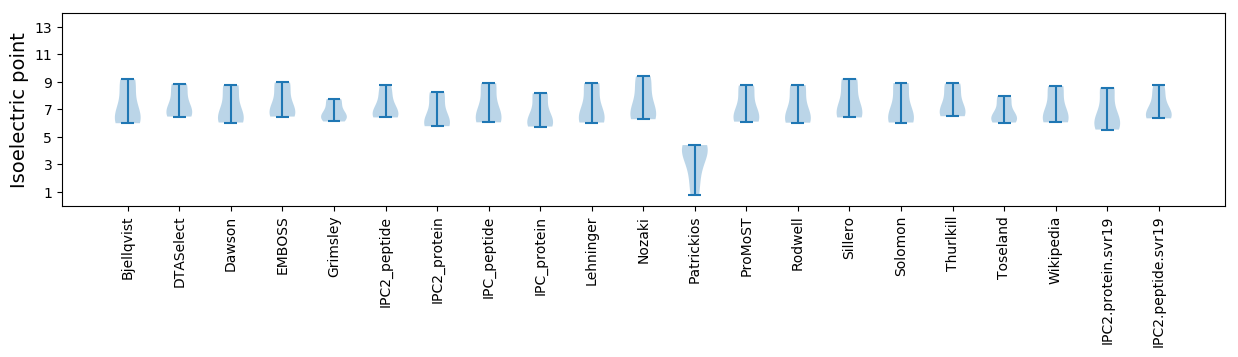
* You can choose from 21 different methods for calculating isoelectric point
Summary statistics related to proteome-wise predictions
Protein with the lowest isoelectric point:
>tr|Q5GR21|Q5GR21_9VIRU Movement protein TGB2 OS=Daphne virus S OX=216614 PE=3 SV=1
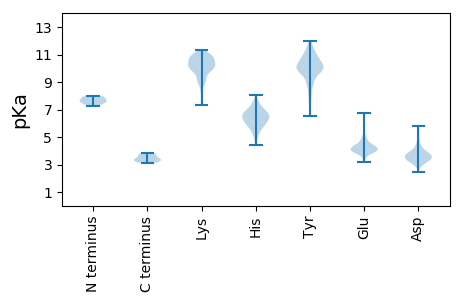
MM1 pKa = 7.54SLNISLSLLHH11 pKa = 6.44VGLIVFTVLCILGSLYY27 pKa = 10.68LSPSGSQCVIIITGEE42 pKa = 3.94SIKK45 pKa = 10.52ILNCEE50 pKa = 3.84MTPAFLEE57 pKa = 4.44YY58 pKa = 10.83AKK60 pKa = 10.23GLHH63 pKa = 5.55VEE65 pKa = 4.9RR66 pKa = 11.84II67 pKa = 3.8
MM1 pKa = 7.54SLNISLSLLHH11 pKa = 6.44VGLIVFTVLCILGSLYY27 pKa = 10.68LSPSGSQCVIIITGEE42 pKa = 3.94SIKK45 pKa = 10.52ILNCEE50 pKa = 3.84MTPAFLEE57 pKa = 4.44YY58 pKa = 10.83AKK60 pKa = 10.23GLHH63 pKa = 5.55VEE65 pKa = 4.9RR66 pKa = 11.84II67 pKa = 3.8
Molecular weight: 7.26 kDa
Isoelectric point according different methods:
Protein with the highest isoelectric point:
>tr|Q5GR22|Q5GR22_9VIRU Triple gene block 1 OS=Daphne virus S OX=216614 PE=4 SV=1
MM1 pKa = 7.95PLTPPPDD8 pKa = 3.32YY9 pKa = 8.4TTAVLVAAATLGATLFISSLTRR31 pKa = 11.84NTQPQVGDD39 pKa = 4.19NIHH42 pKa = 6.25SLPHH46 pKa = 5.15GGYY49 pKa = 9.88YY50 pKa = 10.01KK51 pKa = 10.91DD52 pKa = 3.39GTKK55 pKa = 9.98VVHH58 pKa = 6.2YY59 pKa = 7.73GAPGKK64 pKa = 10.35FNSVEE69 pKa = 4.08FSRR72 pKa = 11.84DD73 pKa = 3.2CYY75 pKa = 8.85FQPWFVIVLLTFLIILSSKK94 pKa = 10.26YY95 pKa = 9.9RR96 pKa = 11.84GHH98 pKa = 6.21TCAACRR104 pKa = 3.74
MM1 pKa = 7.95PLTPPPDD8 pKa = 3.32YY9 pKa = 8.4TTAVLVAAATLGATLFISSLTRR31 pKa = 11.84NTQPQVGDD39 pKa = 4.19NIHH42 pKa = 6.25SLPHH46 pKa = 5.15GGYY49 pKa = 9.88YY50 pKa = 10.01KK51 pKa = 10.91DD52 pKa = 3.39GTKK55 pKa = 9.98VVHH58 pKa = 6.2YY59 pKa = 7.73GAPGKK64 pKa = 10.35FNSVEE69 pKa = 4.08FSRR72 pKa = 11.84DD73 pKa = 3.2CYY75 pKa = 8.85FQPWFVIVLLTFLIILSSKK94 pKa = 10.26YY95 pKa = 9.9RR96 pKa = 11.84GHH98 pKa = 6.21TCAACRR104 pKa = 3.74
Molecular weight: 11.42 kDa
Isoelectric point according different methods:
Peptides (in silico digests for buttom-up proteomics)
Below you can find in silico digests of the whole proteome with Trypsin, Chymotrypsin, Trypsin+LysC, LysN, ArgC proteases suitable for different mass spec machines.| Try ESI |
 |
|---|
| ChTry ESI |
|
|---|
| ArgC ESI |
|
|---|
| LysN ESI |
|
|---|
| TryLysC ESI |
|
|---|
| Try MALDI |
|
|---|
| ChTry MALDI |
|
|---|
| ArgC MALDI |
|
|---|
| LysN MALDI |
|
|---|
| TryLysC MALDI |
|
|---|
| Try LTQ |
|
|---|
| ChTry LTQ |
|
|---|
| ArgC LTQ |
|
|---|
| LysN LTQ |
|
|---|
| TryLysC LTQ |
|
|---|
| Try MSlow |
|
|---|
| ChTry MSlow |
|
|---|
| ArgC MSlow |
|
|---|
| LysN MSlow |
|
|---|
| TryLysC MSlow |
|
|---|
| Try MShigh |
|
|---|
| ChTry MShigh |
|
|---|
| ArgC MShigh |
|
|---|
| LysN MShigh |
|
|---|
| TryLysC MShigh |
|
|---|
General Statistics
Number of major isoforms |
Number of additional isoforms |
Number of all proteins |
Number of amino acids |
Min. Seq. Length |
Max. Seq. Length |
Avg. Seq. Length |
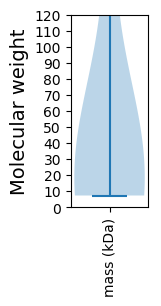
Avg. Mol. Weight |
|---|---|---|---|---|---|---|---|
0 |
2832 |
67 |
2004 |
472.0 |
53.26 |
Amino acid frequency
Ala |
Cys |
Asp |
Glu |
Phe |
Gly |
His |
Ile |
Lys |
Leu |
|---|---|---|---|---|---|---|---|---|---|
7.662 ± 0.892 | 2.507 ± 0.631 |
4.908 ± 0.62 | 7.027 ± 1.067 |
5.191 ± 0.624 | 6.356 ± 0.281 |
2.754 ± 0.274 | 5.544 ± 0.721 |
5.897 ± 1.305 | 9.428 ± 0.739 |
Met |
Asn |
Gln |
Pro |
Arg |
Ser |
Thr |
Val |
Trp |
Tyr |
|---|---|---|---|---|---|---|---|---|---|
2.295 ± 0.511 | 3.919 ± 0.57 |
4.308 ± 1.022 | 3.001 ± 0.242 |
6.109 ± 0.665 | 7.203 ± 0.342 |
4.732 ± 0.582 | 6.356 ± 0.624 |
1.095 ± 0.276 | 3.708 ± 0.307 |
Most of the basic statistics you can see at this page can be downloaded from this CSV file
See this proteome in:

Proteome-pI is available under Creative Commons Attribution-NoDerivs license, for more details see here
| Reference: Kozlowski LP. Proteome-pI 2.0: Proteome Isoelectric Point Database Update. Nucleic Acids Res. 2021, doi: 10.1093/nar/gkab944 | Contact: Lukasz P. Kozlowski |