Curtobacterium sp. Leaf183
Taxonomy: cellular organisms; Bacteria; Terrabacteria group; Actinobacteria; Actinomycetia; Micrococcales; Microbacteriaceae; Curtobacterium; unclassified Curtobacterium
Average proteome isoelectric point is 6.1
Get precalculated fractions of proteins
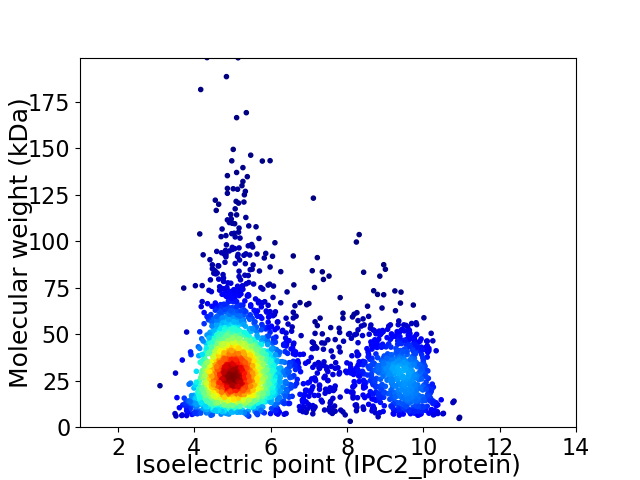
Virtual 2D-PAGE plot for 3232 proteins (isoelectric point calculated using IPC2_protein)
Get csv file with sequences according to given criteria:
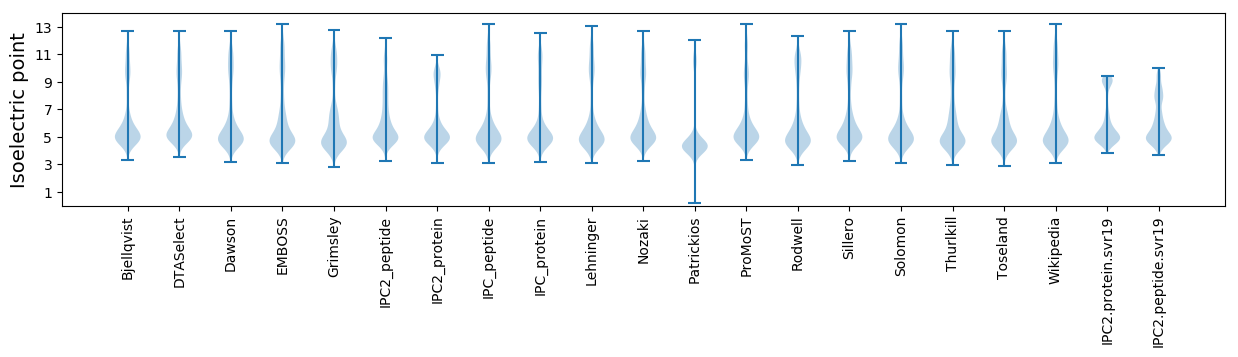
* You can choose from 21 different methods for calculating isoelectric point
Summary statistics related to proteome-wise predictions
Protein with the lowest isoelectric point:
>tr|A0A0Q5RHS8|A0A0Q5RHS8_9MICO Sugar ABC transporter substrate-binding protein OS=Curtobacterium sp. Leaf183 OX=1736291 GN=ASG04_15885 PE=4 SV=1
MM1 pKa = 7.81SEE3 pKa = 4.23QLTNTYY9 pKa = 10.21GITGMTCGHH18 pKa = 6.58CVMSVNEE25 pKa = 4.29EE26 pKa = 3.87LAAVPGVTDD35 pKa = 2.96VTIDD39 pKa = 3.7LNVGGVSTARR49 pKa = 11.84VTSTRR54 pKa = 11.84DD55 pKa = 3.19LPQEE59 pKa = 4.03EE60 pKa = 4.37VSAAVEE66 pKa = 3.96EE67 pKa = 4.33AGYY70 pKa = 8.55TLVASS75 pKa = 4.51
MM1 pKa = 7.81SEE3 pKa = 4.23QLTNTYY9 pKa = 10.21GITGMTCGHH18 pKa = 6.58CVMSVNEE25 pKa = 4.29EE26 pKa = 3.87LAAVPGVTDD35 pKa = 2.96VTIDD39 pKa = 3.7LNVGGVSTARR49 pKa = 11.84VTSTRR54 pKa = 11.84DD55 pKa = 3.19LPQEE59 pKa = 4.03EE60 pKa = 4.37VSAAVEE66 pKa = 3.96EE67 pKa = 4.33AGYY70 pKa = 8.55TLVASS75 pKa = 4.51
Molecular weight: 7.75 kDa
Isoelectric point according different methods:
Protein with the highest isoelectric point:
>tr|A0A0Q5RYE4|A0A0Q5RYE4_9MICO Puromycin resistance protein pur8 OS=Curtobacterium sp. Leaf183 OX=1736291 GN=ASG04_02510 PE=4 SV=1
MM1 pKa = 7.69SKK3 pKa = 9.0RR4 pKa = 11.84TFQPNNRR11 pKa = 11.84RR12 pKa = 11.84RR13 pKa = 11.84AKK15 pKa = 9.97KK16 pKa = 9.33HH17 pKa = 4.25GFRR20 pKa = 11.84LRR22 pKa = 11.84MRR24 pKa = 11.84TRR26 pKa = 11.84AGRR29 pKa = 11.84SILAARR35 pKa = 11.84RR36 pKa = 11.84AKK38 pKa = 10.52GRR40 pKa = 11.84TEE42 pKa = 4.14LSAA45 pKa = 4.86
MM1 pKa = 7.69SKK3 pKa = 9.0RR4 pKa = 11.84TFQPNNRR11 pKa = 11.84RR12 pKa = 11.84RR13 pKa = 11.84AKK15 pKa = 9.97KK16 pKa = 9.33HH17 pKa = 4.25GFRR20 pKa = 11.84LRR22 pKa = 11.84MRR24 pKa = 11.84TRR26 pKa = 11.84AGRR29 pKa = 11.84SILAARR35 pKa = 11.84RR36 pKa = 11.84AKK38 pKa = 10.52GRR40 pKa = 11.84TEE42 pKa = 4.14LSAA45 pKa = 4.86
Molecular weight: 5.3 kDa
Isoelectric point according different methods:
Peptides (in silico digests for buttom-up proteomics)
Below you can find in silico digests of the whole proteome with Trypsin, Chymotrypsin, Trypsin+LysC, LysN, ArgC proteases suitable for different mass spec machines.| Try ESI |
 |
|---|
| ChTry ESI |
|
|---|
| ArgC ESI |
|
|---|
| LysN ESI |
|
|---|
| TryLysC ESI |
|
|---|
| Try MALDI |
|
|---|
| ChTry MALDI |
|
|---|
| ArgC MALDI |
|
|---|
| LysN MALDI |
|
|---|
| TryLysC MALDI |
|
|---|
| Try LTQ |
|
|---|
| ChTry LTQ |
|
|---|
| ArgC LTQ |
|
|---|
| LysN LTQ |
|
|---|
| TryLysC LTQ |
|
|---|
| Try MSlow |
|
|---|
| ChTry MSlow |
|
|---|
| ArgC MSlow |
|
|---|
| LysN MSlow |
|
|---|
| TryLysC MSlow |
|
|---|
| Try MShigh |
|
|---|
| ChTry MShigh |
|
|---|
| ArgC MShigh |
|
|---|
| LysN MShigh |
|
|---|
| TryLysC MShigh |
|
|---|
General Statistics
Number of major isoforms |
Number of additional isoforms |
Number of all proteins |
Number of amino acids |
Min. Seq. Length |
Max. Seq. Length |
Avg. Seq. Length |
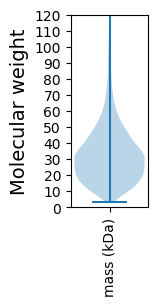
Avg. Mol. Weight |
|---|---|---|---|---|---|---|---|
0 |
1037927 |
29 |
1933 |
321.1 |
34.19 |
Amino acid frequency
Ala |
Cys |
Asp |
Glu |
Phe |
Gly |
His |
Ile |
Lys |
Leu |
|---|---|---|---|---|---|---|---|---|---|
13.558 ± 0.05 | 0.447 ± 0.01 |
6.715 ± 0.041 | 4.817 ± 0.047 |
3.029 ± 0.027 | 9.099 ± 0.039 |
2.07 ± 0.025 | 3.807 ± 0.029 |
1.845 ± 0.031 | 9.622 ± 0.051 |
Met |
Asn |
Gln |
Pro |
Arg |
Ser |
Thr |
Val |
Trp |
Tyr |
|---|---|---|---|---|---|---|---|---|---|
1.708 ± 0.015 | 1.798 ± 0.022 |
5.383 ± 0.026 | 2.983 ± 0.028 |
7.355 ± 0.053 | 5.632 ± 0.039 |
6.746 ± 0.044 | 10.031 ± 0.045 |
1.508 ± 0.02 | 1.847 ± 0.021 |
Most of the basic statistics you can see at this page can be downloaded from this CSV file
See this proteome in:

Proteome-pI is available under Creative Commons Attribution-NoDerivs license, for more details see here
| Reference: Kozlowski LP. Proteome-pI 2.0: Proteome Isoelectric Point Database Update. Nucleic Acids Res. 2021, doi: 10.1093/nar/gkab944 | Contact: Lukasz P. Kozlowski |