Mycobacterium phage Llama
Taxonomy: Viruses; Duplodnaviria; Heunggongvirae; Uroviricota; Caudoviricetes; Caudovirales; Siphoviridae; Cheoctovirus; unclassified Cheoctovirus
Average proteome isoelectric point is 6.14
Get precalculated fractions of proteins
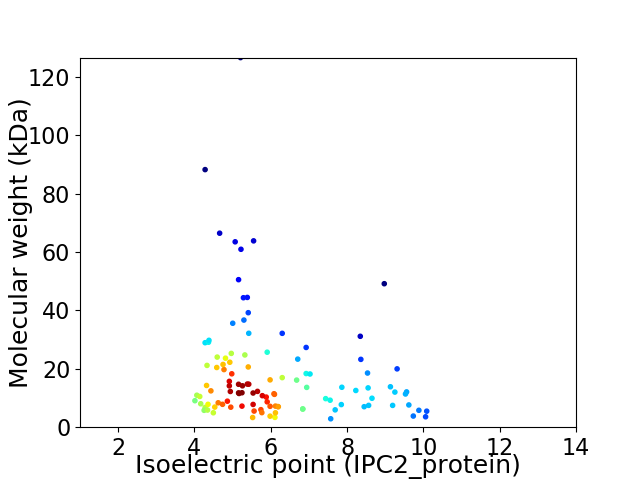
Virtual 2D-PAGE plot for 111 proteins (isoelectric point calculated using IPC2_protein)
Get csv file with sequences according to given criteria:
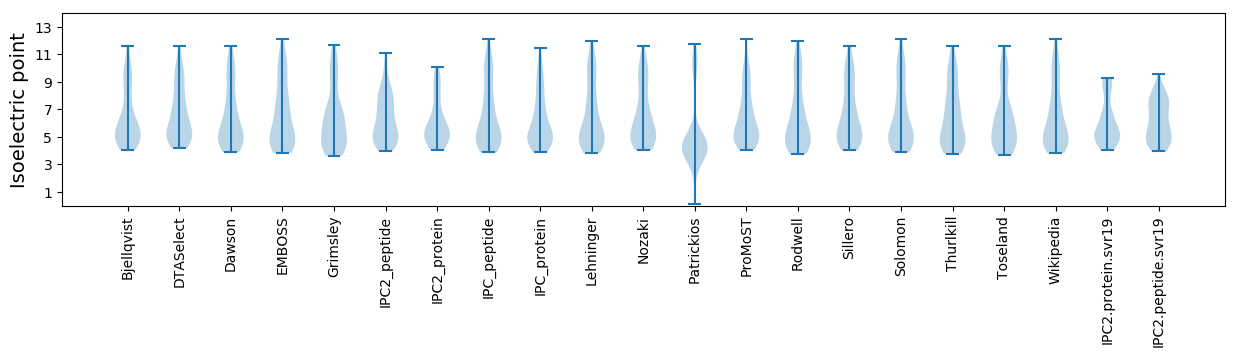
* You can choose from 21 different methods for calculating isoelectric point
Summary statistics related to proteome-wise predictions
Protein with the lowest isoelectric point:
>tr|A0A088FWF7|A0A088FWF7_9CAUD Uncharacterized protein OS=Mycobacterium phage Llama OX=1541823 GN=82 PE=4 SV=1
MM1 pKa = 7.44TCLLCDD7 pKa = 4.01HH8 pKa = 7.18PRR10 pKa = 11.84STHH13 pKa = 5.0TPQCRR18 pKa = 11.84VRR20 pKa = 11.84LGVDD24 pKa = 2.92ADD26 pKa = 3.62DD27 pKa = 3.59MTRR30 pKa = 11.84YY31 pKa = 6.71TQCLCPGFEE40 pKa = 4.22GTEE43 pKa = 4.11EE44 pKa = 5.26EE45 pKa = 4.28EE46 pKa = 4.68DD47 pKa = 3.38TWLDD51 pKa = 3.26
MM1 pKa = 7.44TCLLCDD7 pKa = 4.01HH8 pKa = 7.18PRR10 pKa = 11.84STHH13 pKa = 5.0TPQCRR18 pKa = 11.84VRR20 pKa = 11.84LGVDD24 pKa = 2.92ADD26 pKa = 3.62DD27 pKa = 3.59MTRR30 pKa = 11.84YY31 pKa = 6.71TQCLCPGFEE40 pKa = 4.22GTEE43 pKa = 4.11EE44 pKa = 5.26EE45 pKa = 4.28EE46 pKa = 4.68DD47 pKa = 3.38TWLDD51 pKa = 3.26
Molecular weight: 5.88 kDa
Isoelectric point according different methods:
Protein with the highest isoelectric point:
>tr|A0A088FW61|A0A088FW61_9CAUD Holin OS=Mycobacterium phage Llama OX=1541823 GN=32 PE=4 SV=1
MM1 pKa = 6.83QASAKK6 pKa = 9.73HH7 pKa = 6.14CLEE10 pKa = 3.96AMPPKK15 pKa = 9.4QCTYY19 pKa = 8.12VTYY22 pKa = 11.07VLTKK26 pKa = 9.79NYY28 pKa = 10.15SPLVSRR34 pKa = 11.84LTLGIARR41 pKa = 11.84RR42 pKa = 11.84GGRR45 pKa = 11.84TNFPQMEE52 pKa = 4.95KK53 pKa = 10.08ILAFAPLGRR62 pKa = 11.84SQEE65 pKa = 4.12PVRR68 pKa = 4.75
MM1 pKa = 6.83QASAKK6 pKa = 9.73HH7 pKa = 6.14CLEE10 pKa = 3.96AMPPKK15 pKa = 9.4QCTYY19 pKa = 8.12VTYY22 pKa = 11.07VLTKK26 pKa = 9.79NYY28 pKa = 10.15SPLVSRR34 pKa = 11.84LTLGIARR41 pKa = 11.84RR42 pKa = 11.84GGRR45 pKa = 11.84TNFPQMEE52 pKa = 4.95KK53 pKa = 10.08ILAFAPLGRR62 pKa = 11.84SQEE65 pKa = 4.12PVRR68 pKa = 4.75
Molecular weight: 7.62 kDa
Isoelectric point according different methods:
Peptides (in silico digests for buttom-up proteomics)
Below you can find in silico digests of the whole proteome with Trypsin, Chymotrypsin, Trypsin+LysC, LysN, ArgC proteases suitable for different mass spec machines.| Try ESI |
 |
|---|
| ChTry ESI |
|
|---|
| ArgC ESI |
|
|---|
| LysN ESI |
|
|---|
| TryLysC ESI |
|
|---|
| Try MALDI |
|
|---|
| ChTry MALDI |
|
|---|
| ArgC MALDI |
|
|---|
| LysN MALDI |
|
|---|
| TryLysC MALDI |
|
|---|
| Try LTQ |
|
|---|
| ChTry LTQ |
|
|---|
| ArgC LTQ |
|
|---|
| LysN LTQ |
|
|---|
| TryLysC LTQ |
|
|---|
| Try MSlow |
|
|---|
| ChTry MSlow |
|
|---|
| ArgC MSlow |
|
|---|
| LysN MSlow |
|
|---|
| TryLysC MSlow |
|
|---|
| Try MShigh |
|
|---|
| ChTry MShigh |
|
|---|
| ArgC MShigh |
|
|---|
| LysN MShigh |
|
|---|
| TryLysC MShigh |
|
|---|
General Statistics
Number of major isoforms |
Number of additional isoforms |
Number of all proteins |
Number of amino acids |
Min. Seq. Length |
Max. Seq. Length |
Avg. Seq. Length |
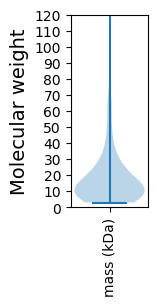
Avg. Mol. Weight |
|---|---|---|---|---|---|---|---|
0 |
18761 |
25 |
1252 |
169.0 |
18.47 |
Amino acid frequency
Ala |
Cys |
Asp |
Glu |
Phe |
Gly |
His |
Ile |
Lys |
Leu |
|---|---|---|---|---|---|---|---|---|---|
10.778 ± 0.499 | 1.157 ± 0.168 |
6.455 ± 0.244 | 6.028 ± 0.361 |
3.001 ± 0.208 | 8.891 ± 0.607 |
2.271 ± 0.187 | 4.301 ± 0.19 |
3.374 ± 0.205 | 7.233 ± 0.224 |
Met |
Asn |
Gln |
Pro |
Arg |
Ser |
Thr |
Val |
Trp |
Tyr |
|---|---|---|---|---|---|---|---|---|---|
2.196 ± 0.125 | 3.177 ± 0.159 |
5.911 ± 0.184 | 3.561 ± 0.188 |
6.945 ± 0.429 | 6.119 ± 0.306 |
6.641 ± 0.248 | 7.18 ± 0.248 |
2.313 ± 0.152 | 2.468 ± 0.159 |
Most of the basic statistics you can see at this page can be downloaded from this CSV file
See this proteome in:

Proteome-pI is available under Creative Commons Attribution-NoDerivs license, for more details see here
| Reference: Kozlowski LP. Proteome-pI 2.0: Proteome Isoelectric Point Database Update. Nucleic Acids Res. 2021, doi: 10.1093/nar/gkab944 | Contact: Lukasz P. Kozlowski |