Stegodyphus mimosarum (African social velvet spider)
Taxonomy: cellular organisms; Eukaryota; Opisthokonta; Metazoa; Eumetazoa; Bilateria; Protostomia; Ecdysozoa; Panarthropoda; Arthropoda; Chelicerata; Arachnida; Araneae; Araneomorphae; Entelegynae; Eresoidea; Eresidae; Stegodyphus
Average proteome isoelectric point is 7.08
Get precalculated fractions of proteins
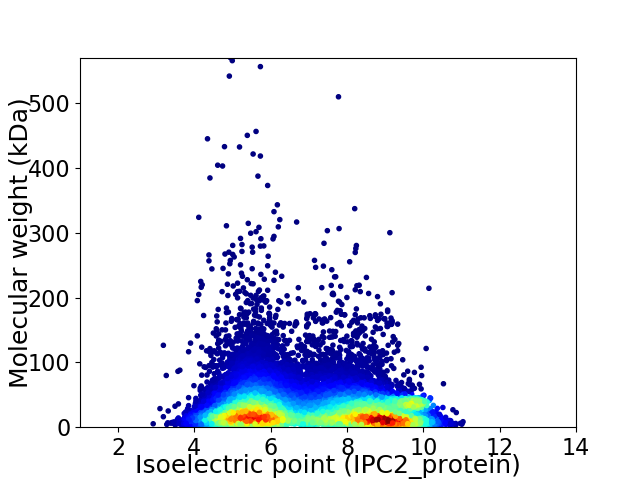
Virtual 2D-PAGE plot for 27009 proteins (isoelectric point calculated using IPC2_protein)
Get csv file with sequences according to given criteria:
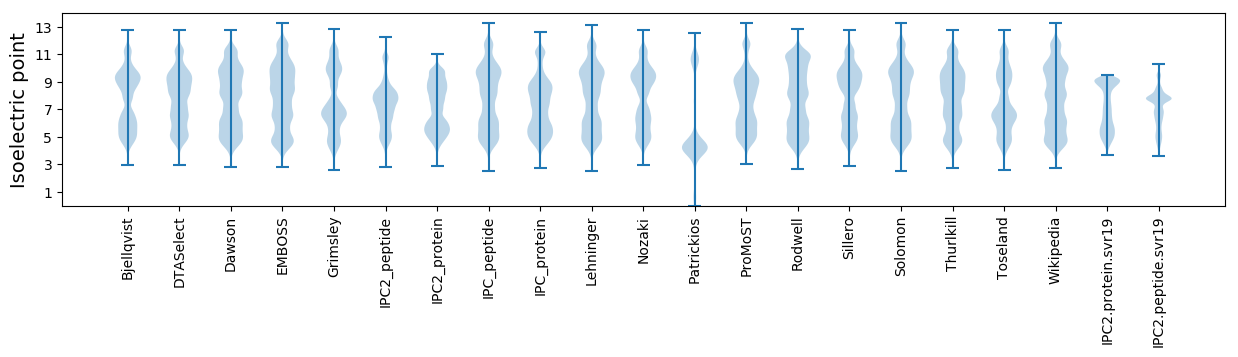
* You can choose from 21 different methods for calculating isoelectric point
Summary statistics related to proteome-wise predictions
Protein with the lowest isoelectric point:
>tr|A0A087TSS8|A0A087TSS8_STEMI Uncharacterized protein (Fragment) OS=Stegodyphus mimosarum OX=407821 GN=X975_22046 PE=4 SV=1
MM1 pKa = 7.56LLKK4 pKa = 10.65NYY6 pKa = 9.69APPTEE11 pKa = 5.1GIHH14 pKa = 6.0HH15 pKa = 7.27AEE17 pKa = 4.36PNVTAYY23 pKa = 10.58FGDD26 pKa = 3.77KK27 pKa = 10.79NLGKK31 pKa = 8.67GTLYY35 pKa = 10.16ISEE38 pKa = 5.38SVLCWLTSSGDD49 pKa = 3.83GFSLSYY55 pKa = 9.92PSIYY59 pKa = 9.91IHH61 pKa = 7.55AISKK65 pKa = 10.03DD66 pKa = 3.76LNNFPYY72 pKa = 10.39EE73 pKa = 4.24CLYY76 pKa = 11.52LMIDD80 pKa = 3.51EE81 pKa = 5.77KK82 pKa = 10.72ITISEE87 pKa = 3.87VSEE90 pKa = 4.07IQDD93 pKa = 3.25EE94 pKa = 4.4VSEE97 pKa = 4.21DD98 pKa = 3.51QEE100 pKa = 4.99LRR102 pKa = 11.84SALNNLAVEE111 pKa = 4.31EE112 pKa = 4.61EE113 pKa = 4.38EE114 pKa = 5.45DD115 pKa = 4.74DD116 pKa = 4.01SLEE119 pKa = 4.05PAEE122 pKa = 4.14MHH124 pKa = 6.53FVPDD128 pKa = 4.01NKK130 pKa = 10.94NMLDD134 pKa = 3.5VMYY137 pKa = 10.48KK138 pKa = 10.41ALCDD142 pKa = 3.87CQALHH147 pKa = 7.26PDD149 pKa = 4.05SPTKK153 pKa = 10.96DD154 pKa = 3.43EE155 pKa = 5.62DD156 pKa = 4.43DD157 pKa = 4.49DD158 pKa = 5.57DD159 pKa = 6.15EE160 pKa = 5.81IVLPPISIQHH170 pKa = 6.03ANGVLEE176 pKa = 4.27EE177 pKa = 4.16MDD179 pKa = 5.2DD180 pKa = 4.04VVEE183 pKa = 5.32DD184 pKa = 4.38DD185 pKa = 4.19SDD187 pKa = 3.52MDD189 pKa = 3.74EE190 pKa = 4.52EE191 pKa = 4.21QFEE194 pKa = 4.45DD195 pKa = 4.47AEE197 pKa = 4.29QQ198 pKa = 3.61
MM1 pKa = 7.56LLKK4 pKa = 10.65NYY6 pKa = 9.69APPTEE11 pKa = 5.1GIHH14 pKa = 6.0HH15 pKa = 7.27AEE17 pKa = 4.36PNVTAYY23 pKa = 10.58FGDD26 pKa = 3.77KK27 pKa = 10.79NLGKK31 pKa = 8.67GTLYY35 pKa = 10.16ISEE38 pKa = 5.38SVLCWLTSSGDD49 pKa = 3.83GFSLSYY55 pKa = 9.92PSIYY59 pKa = 9.91IHH61 pKa = 7.55AISKK65 pKa = 10.03DD66 pKa = 3.76LNNFPYY72 pKa = 10.39EE73 pKa = 4.24CLYY76 pKa = 11.52LMIDD80 pKa = 3.51EE81 pKa = 5.77KK82 pKa = 10.72ITISEE87 pKa = 3.87VSEE90 pKa = 4.07IQDD93 pKa = 3.25EE94 pKa = 4.4VSEE97 pKa = 4.21DD98 pKa = 3.51QEE100 pKa = 4.99LRR102 pKa = 11.84SALNNLAVEE111 pKa = 4.31EE112 pKa = 4.61EE113 pKa = 4.38EE114 pKa = 5.45DD115 pKa = 4.74DD116 pKa = 4.01SLEE119 pKa = 4.05PAEE122 pKa = 4.14MHH124 pKa = 6.53FVPDD128 pKa = 4.01NKK130 pKa = 10.94NMLDD134 pKa = 3.5VMYY137 pKa = 10.48KK138 pKa = 10.41ALCDD142 pKa = 3.87CQALHH147 pKa = 7.26PDD149 pKa = 4.05SPTKK153 pKa = 10.96DD154 pKa = 3.43EE155 pKa = 5.62DD156 pKa = 4.43DD157 pKa = 4.49DD158 pKa = 5.57DD159 pKa = 6.15EE160 pKa = 5.81IVLPPISIQHH170 pKa = 6.03ANGVLEE176 pKa = 4.27EE177 pKa = 4.16MDD179 pKa = 5.2DD180 pKa = 4.04VVEE183 pKa = 5.32DD184 pKa = 4.38DD185 pKa = 4.19SDD187 pKa = 3.52MDD189 pKa = 3.74EE190 pKa = 4.52EE191 pKa = 4.21QFEE194 pKa = 4.45DD195 pKa = 4.47AEE197 pKa = 4.29QQ198 pKa = 3.61
Molecular weight: 22.33 kDa
Isoelectric point according different methods:
Protein with the highest isoelectric point:
>tr|A0A087TGT9|A0A087TGT9_STEMI Zinc finger protein 595 (Fragment) OS=Stegodyphus mimosarum OX=407821 GN=X975_23760 PE=4 SV=1
MM1 pKa = 7.7PSLRR5 pKa = 11.84LTLRR9 pKa = 11.84KK10 pKa = 9.12PLIVSRR16 pKa = 11.84RR17 pKa = 11.84QQRR20 pKa = 11.84ASKK23 pKa = 9.1TVGRR27 pKa = 11.84TRR29 pKa = 11.84GRR31 pKa = 11.84RR32 pKa = 11.84KK33 pKa = 9.72RR34 pKa = 11.84RR35 pKa = 11.84ILCTHH40 pKa = 6.47NPSGHH45 pKa = 6.52HH46 pKa = 5.16FRR48 pKa = 11.84KK49 pKa = 9.74SRR51 pKa = 11.84LRR53 pKa = 11.84HH54 pKa = 5.17SSLVV58 pKa = 3.38
MM1 pKa = 7.7PSLRR5 pKa = 11.84LTLRR9 pKa = 11.84KK10 pKa = 9.12PLIVSRR16 pKa = 11.84RR17 pKa = 11.84QQRR20 pKa = 11.84ASKK23 pKa = 9.1TVGRR27 pKa = 11.84TRR29 pKa = 11.84GRR31 pKa = 11.84RR32 pKa = 11.84KK33 pKa = 9.72RR34 pKa = 11.84RR35 pKa = 11.84ILCTHH40 pKa = 6.47NPSGHH45 pKa = 6.52HH46 pKa = 5.16FRR48 pKa = 11.84KK49 pKa = 9.74SRR51 pKa = 11.84LRR53 pKa = 11.84HH54 pKa = 5.17SSLVV58 pKa = 3.38
Molecular weight: 6.88 kDa
Isoelectric point according different methods:
Peptides (in silico digests for buttom-up proteomics)
Below you can find in silico digests of the whole proteome with Trypsin, Chymotrypsin, Trypsin+LysC, LysN, ArgC proteases suitable for different mass spec machines.| Try ESI |
 |
|---|
| ChTry ESI |
|
|---|
| ArgC ESI |
|
|---|
| LysN ESI |
|
|---|
| TryLysC ESI |
|
|---|
| Try MALDI |
|
|---|
| ChTry MALDI |
|
|---|
| ArgC MALDI |
|
|---|
| LysN MALDI |
|
|---|
| TryLysC MALDI |
|
|---|
| Try LTQ |
|
|---|
| ChTry LTQ |
|
|---|
| ArgC LTQ |
|
|---|
| LysN LTQ |
|
|---|
| TryLysC LTQ |
|
|---|
| Try MSlow |
|
|---|
| ChTry MSlow |
|
|---|
| ArgC MSlow |
|
|---|
| LysN MSlow |
|
|---|
| TryLysC MSlow |
|
|---|
| Try MShigh |
|
|---|
| ChTry MShigh |
|
|---|
| ArgC MShigh |
|
|---|
| LysN MShigh |
|
|---|
| TryLysC MShigh |
|
|---|
General Statistics
Number of major isoforms |
Number of additional isoforms |
Number of all proteins |
Number of amino acids |
Min. Seq. Length |
Max. Seq. Length |
Avg. Seq. Length |
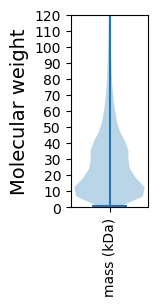
Avg. Mol. Weight |
|---|---|---|---|---|---|---|---|
7704465 |
8 |
5000 |
285.3 |
32.32 |
Amino acid frequency
Ala |
Cys |
Asp |
Glu |
Phe |
Gly |
His |
Ile |
Lys |
Leu |
|---|---|---|---|---|---|---|---|---|---|
5.908 ± 0.025 | 2.344 ± 0.019 |
5.246 ± 0.015 | 6.605 ± 0.027 |
4.062 ± 0.013 | 5.093 ± 0.025 |
2.778 ± 0.013 | 5.737 ± 0.014 |
6.669 ± 0.026 | 9.024 ± 0.024 |
Met |
Asn |
Gln |
Pro |
Arg |
Ser |
Thr |
Val |
Trp |
Tyr |
|---|---|---|---|---|---|---|---|---|---|
2.397 ± 0.008 | 4.902 ± 0.017 |
4.898 ± 0.02 | 4.08 ± 0.016 |
5.696 ± 0.026 | 8.628 ± 0.028 |
5.413 ± 0.017 | 6.144 ± 0.014 |
1.259 ± 0.008 | 3.101 ± 0.011 |
Most of the basic statistics you can see at this page can be downloaded from this CSV file
See this proteome in:

Proteome-pI is available under Creative Commons Attribution-NoDerivs license, for more details see here
| Reference: Kozlowski LP. Proteome-pI 2.0: Proteome Isoelectric Point Database Update. Nucleic Acids Res. 2021, doi: 10.1093/nar/gkab944 | Contact: Lukasz P. Kozlowski |