Gordonia rhizosphera NBRC 16068
Taxonomy: cellular organisms; Bacteria; Terrabacteria group; Actinobacteria; Actinomycetia; Corynebacteriales; Gordoniaceae; Gordonia; Gordonia rhizosphera
Average proteome isoelectric point is 5.88
Get precalculated fractions of proteins
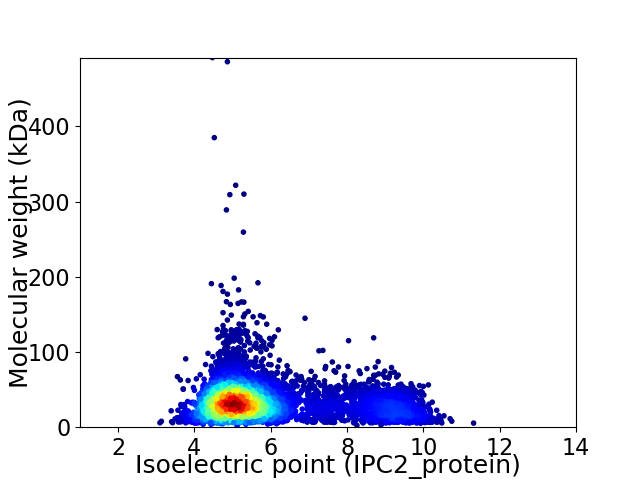
Virtual 2D-PAGE plot for 5930 proteins (isoelectric point calculated using IPC2_protein)
Get csv file with sequences according to given criteria:
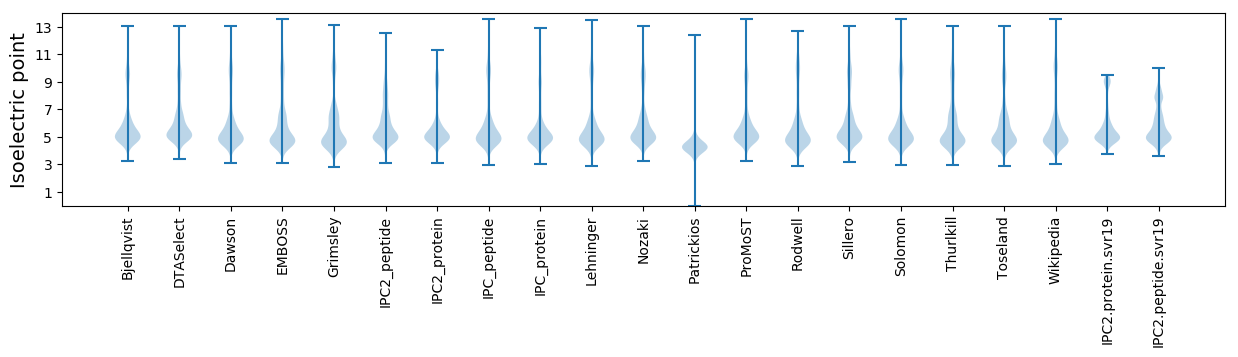
* You can choose from 21 different methods for calculating isoelectric point
Summary statistics related to proteome-wise predictions
Protein with the lowest isoelectric point:
>tr|K6X1L0|K6X1L0_9ACTN Putative oxidoreductase OS=Gordonia rhizosphera NBRC 16068 OX=1108045 GN=GORHZ_186_00600 PE=4 SV=1
MM1 pKa = 7.19LTRR4 pKa = 11.84RR5 pKa = 11.84SVGYY9 pKa = 10.5DD10 pKa = 3.35SEE12 pKa = 4.85SDD14 pKa = 3.46NAPTRR19 pKa = 11.84LAAYY23 pKa = 10.42LSDD26 pKa = 3.75EE27 pKa = 4.16PVAAGVDD34 pKa = 3.33IGVSDD39 pKa = 3.66QTFEE43 pKa = 4.02AWLQAASVYY52 pKa = 11.18DD53 pKa = 3.61NVVPQLASAVCADD66 pKa = 3.75DD67 pKa = 5.02HH68 pKa = 7.18LAGLLANDD76 pKa = 4.06TQQ78 pKa = 3.74
MM1 pKa = 7.19LTRR4 pKa = 11.84RR5 pKa = 11.84SVGYY9 pKa = 10.5DD10 pKa = 3.35SEE12 pKa = 4.85SDD14 pKa = 3.46NAPTRR19 pKa = 11.84LAAYY23 pKa = 10.42LSDD26 pKa = 3.75EE27 pKa = 4.16PVAAGVDD34 pKa = 3.33IGVSDD39 pKa = 3.66QTFEE43 pKa = 4.02AWLQAASVYY52 pKa = 11.18DD53 pKa = 3.61NVVPQLASAVCADD66 pKa = 3.75DD67 pKa = 5.02HH68 pKa = 7.18LAGLLANDD76 pKa = 4.06TQQ78 pKa = 3.74
Molecular weight: 8.23 kDa
Isoelectric point according different methods:
Protein with the highest isoelectric point:
>tr|K6WNA0|K6WNA0_9ACTN Putative esterase OS=Gordonia rhizosphera NBRC 16068 OX=1108045 GN=GORHZ_233_00320 PE=3 SV=1
MM1 pKa = 7.69AKK3 pKa = 10.06GKK5 pKa = 8.69RR6 pKa = 11.84TFQPNNRR13 pKa = 11.84RR14 pKa = 11.84RR15 pKa = 11.84ARR17 pKa = 11.84VHH19 pKa = 5.99GFRR22 pKa = 11.84LRR24 pKa = 11.84MRR26 pKa = 11.84TRR28 pKa = 11.84AGRR31 pKa = 11.84AIVNGRR37 pKa = 11.84RR38 pKa = 11.84SKK40 pKa = 10.92GRR42 pKa = 11.84AKK44 pKa = 9.67LTAA47 pKa = 4.21
MM1 pKa = 7.69AKK3 pKa = 10.06GKK5 pKa = 8.69RR6 pKa = 11.84TFQPNNRR13 pKa = 11.84RR14 pKa = 11.84RR15 pKa = 11.84ARR17 pKa = 11.84VHH19 pKa = 5.99GFRR22 pKa = 11.84LRR24 pKa = 11.84MRR26 pKa = 11.84TRR28 pKa = 11.84AGRR31 pKa = 11.84AIVNGRR37 pKa = 11.84RR38 pKa = 11.84SKK40 pKa = 10.92GRR42 pKa = 11.84AKK44 pKa = 9.67LTAA47 pKa = 4.21
Molecular weight: 5.46 kDa
Isoelectric point according different methods:
Peptides (in silico digests for buttom-up proteomics)
Below you can find in silico digests of the whole proteome with Trypsin, Chymotrypsin, Trypsin+LysC, LysN, ArgC proteases suitable for different mass spec machines.| Try ESI |
 |
|---|
| ChTry ESI |
|
|---|
| ArgC ESI |
|
|---|
| LysN ESI |
|
|---|
| TryLysC ESI |
|
|---|
| Try MALDI |
|
|---|
| ChTry MALDI |
|
|---|
| ArgC MALDI |
|
|---|
| LysN MALDI |
|
|---|
| TryLysC MALDI |
|
|---|
| Try LTQ |
|
|---|
| ChTry LTQ |
|
|---|
| ArgC LTQ |
|
|---|
| LysN LTQ |
|
|---|
| TryLysC LTQ |
|
|---|
| Try MSlow |
|
|---|
| ChTry MSlow |
|
|---|
| ArgC MSlow |
|
|---|
| LysN MSlow |
|
|---|
| TryLysC MSlow |
|
|---|
| Try MShigh |
|
|---|
| ChTry MShigh |
|
|---|
| ArgC MShigh |
|
|---|
| LysN MShigh |
|
|---|
| TryLysC MShigh |
|
|---|
General Statistics
Number of major isoforms |
Number of additional isoforms |
Number of all proteins |
Number of amino acids |
Min. Seq. Length |
Max. Seq. Length |
Avg. Seq. Length |
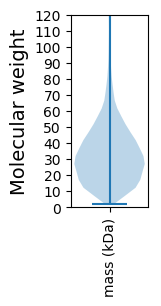
Avg. Mol. Weight |
|---|---|---|---|---|---|---|---|
0 |
1941780 |
19 |
4653 |
327.5 |
35.18 |
Amino acid frequency
Ala |
Cys |
Asp |
Glu |
Phe |
Gly |
His |
Ile |
Lys |
Leu |
|---|---|---|---|---|---|---|---|---|---|
12.661 ± 0.041 | 0.798 ± 0.01 |
6.729 ± 0.027 | 5.317 ± 0.028 |
3.019 ± 0.019 | 8.877 ± 0.026 |
2.285 ± 0.017 | 4.594 ± 0.017 |
2.014 ± 0.022 | 9.503 ± 0.033 |
Met |
Asn |
Gln |
Pro |
Arg |
Ser |
Thr |
Val |
Trp |
Tyr |
|---|---|---|---|---|---|---|---|---|---|
2.104 ± 0.014 | 2.095 ± 0.014 |
5.584 ± 0.022 | 2.69 ± 0.017 |
7.404 ± 0.032 | 5.563 ± 0.018 |
6.387 ± 0.025 | 8.828 ± 0.033 |
1.47 ± 0.013 | 2.077 ± 0.015 |
Most of the basic statistics you can see at this page can be downloaded from this CSV file
See this proteome in:

Proteome-pI is available under Creative Commons Attribution-NoDerivs license, for more details see here
| Reference: Kozlowski LP. Proteome-pI 2.0: Proteome Isoelectric Point Database Update. Nucleic Acids Res. 2021, doi: 10.1093/nar/gkab944 | Contact: Lukasz P. Kozlowski |