Pseudonocardia thermophila
Taxonomy: cellular organisms;
Average proteome isoelectric point is 6.23
Get precalculated fractions of proteins
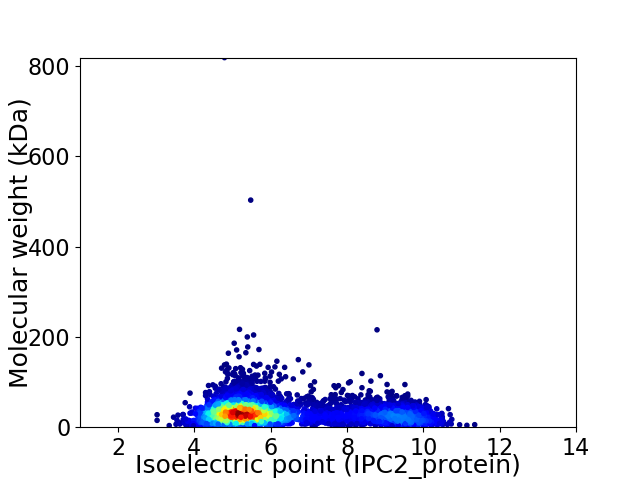
Virtual 2D-PAGE plot for 5850 proteins (isoelectric point calculated using IPC2_protein)
Get csv file with sequences according to given criteria:
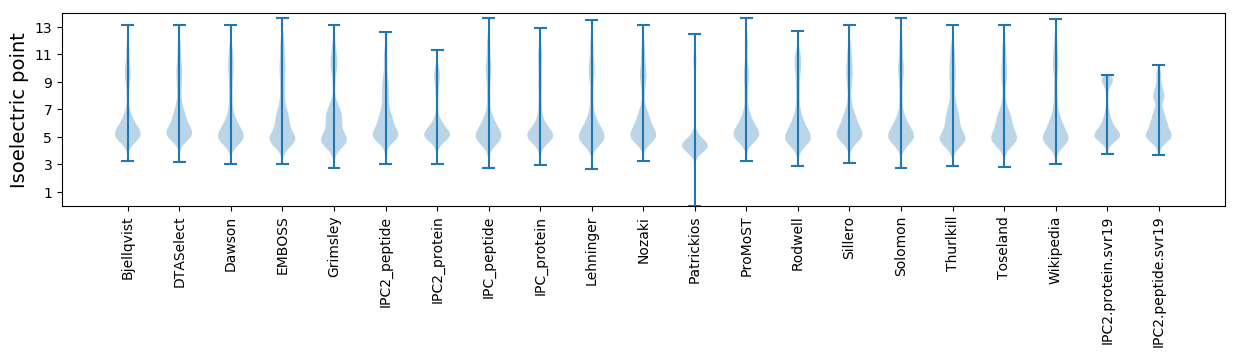
* You can choose from 21 different methods for calculating isoelectric point
Summary statistics related to proteome-wise predictions
Protein with the lowest isoelectric point:
>tr|A0A1M6TQH6|A0A1M6TQH6_PSETH TIGR00288 family protein OS=Pseudonocardia thermophila OX=1848 GN=SAMN05443637_108184 PE=4 SV=1
MM1 pKa = 7.62AVQLDD6 pKa = 4.19DD7 pKa = 3.78QLMDD11 pKa = 4.22ILACPADD18 pKa = 3.97HH19 pKa = 7.15APLRR23 pKa = 11.84VGTAADD29 pKa = 3.6PAADD33 pKa = 3.57VLTCTACGLRR43 pKa = 11.84YY44 pKa = 9.03PVVDD48 pKa = 5.37GIPVLLADD56 pKa = 3.91EE57 pKa = 4.9ALPAEE62 pKa = 4.53AAADD66 pKa = 3.88GAGAA70 pKa = 4.01
MM1 pKa = 7.62AVQLDD6 pKa = 4.19DD7 pKa = 3.78QLMDD11 pKa = 4.22ILACPADD18 pKa = 3.97HH19 pKa = 7.15APLRR23 pKa = 11.84VGTAADD29 pKa = 3.6PAADD33 pKa = 3.57VLTCTACGLRR43 pKa = 11.84YY44 pKa = 9.03PVVDD48 pKa = 5.37GIPVLLADD56 pKa = 3.91EE57 pKa = 4.9ALPAEE62 pKa = 4.53AAADD66 pKa = 3.88GAGAA70 pKa = 4.01
Molecular weight: 6.97 kDa
Isoelectric point according different methods:
Protein with the highest isoelectric point:
>tr|A0A1M6VI91|A0A1M6VI91_PSETH NUDIX domain-containing protein OS=Pseudonocardia thermophila OX=1848 GN=SAMN05443637_112143 PE=3 SV=1
MM1 pKa = 7.53SKK3 pKa = 10.53GKK5 pKa = 8.66RR6 pKa = 11.84TFQPNNRR13 pKa = 11.84RR14 pKa = 11.84RR15 pKa = 11.84ARR17 pKa = 11.84KK18 pKa = 8.65HH19 pKa = 4.47GFRR22 pKa = 11.84LRR24 pKa = 11.84MRR26 pKa = 11.84TRR28 pKa = 11.84AGRR31 pKa = 11.84AIIANRR37 pKa = 11.84RR38 pKa = 11.84SKK40 pKa = 11.14GRR42 pKa = 11.84VRR44 pKa = 11.84LSAA47 pKa = 3.96
MM1 pKa = 7.53SKK3 pKa = 10.53GKK5 pKa = 8.66RR6 pKa = 11.84TFQPNNRR13 pKa = 11.84RR14 pKa = 11.84RR15 pKa = 11.84ARR17 pKa = 11.84KK18 pKa = 8.65HH19 pKa = 4.47GFRR22 pKa = 11.84LRR24 pKa = 11.84MRR26 pKa = 11.84TRR28 pKa = 11.84AGRR31 pKa = 11.84AIIANRR37 pKa = 11.84RR38 pKa = 11.84SKK40 pKa = 11.14GRR42 pKa = 11.84VRR44 pKa = 11.84LSAA47 pKa = 3.96
Molecular weight: 5.58 kDa
Isoelectric point according different methods:
Peptides (in silico digests for buttom-up proteomics)
Below you can find in silico digests of the whole proteome with Trypsin, Chymotrypsin, Trypsin+LysC, LysN, ArgC proteases suitable for different mass spec machines.| Try ESI |
 |
|---|
| ChTry ESI |
|
|---|
| ArgC ESI |
|
|---|
| LysN ESI |
|
|---|
| TryLysC ESI |
|
|---|
| Try MALDI |
|
|---|
| ChTry MALDI |
|
|---|
| ArgC MALDI |
|
|---|
| LysN MALDI |
|
|---|
| TryLysC MALDI |
|
|---|
| Try LTQ |
|
|---|
| ChTry LTQ |
|
|---|
| ArgC LTQ |
|
|---|
| LysN LTQ |
|
|---|
| TryLysC LTQ |
|
|---|
| Try MSlow |
|
|---|
| ChTry MSlow |
|
|---|
| ArgC MSlow |
|
|---|
| LysN MSlow |
|
|---|
| TryLysC MSlow |
|
|---|
| Try MShigh |
|
|---|
| ChTry MShigh |
|
|---|
| ArgC MShigh |
|
|---|
| LysN MShigh |
|
|---|
| TryLysC MShigh |
|
|---|
General Statistics
Number of major isoforms |
Number of additional isoforms |
Number of all proteins |
Number of amino acids |
Min. Seq. Length |
Max. Seq. Length |
Avg. Seq. Length |
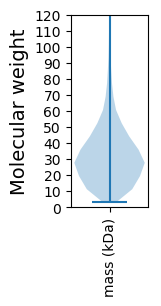
Avg. Mol. Weight |
|---|---|---|---|---|---|---|---|
0 |
1837469 |
27 |
7715 |
314.1 |
33.5 |
Amino acid frequency
Ala |
Cys |
Asp |
Glu |
Phe |
Gly |
His |
Ile |
Lys |
Leu |
|---|---|---|---|---|---|---|---|---|---|
14.388 ± 0.059 | 0.798 ± 0.01 |
5.965 ± 0.028 | 5.761 ± 0.029 |
2.647 ± 0.016 | 9.2 ± 0.032 |
2.188 ± 0.015 | 3.54 ± 0.024 |
1.614 ± 0.024 | 10.318 ± 0.037 |
Met |
Asn |
Gln |
Pro |
Arg |
Ser |
Thr |
Val |
Trp |
Tyr |
|---|---|---|---|---|---|---|---|---|---|
1.685 ± 0.013 | 1.538 ± 0.015 |
6.412 ± 0.028 | 2.571 ± 0.018 |
8.342 ± 0.03 | 4.435 ± 0.022 |
5.868 ± 0.022 | 9.481 ± 0.031 |
1.425 ± 0.012 | 1.824 ± 0.013 |
Most of the basic statistics you can see at this page can be downloaded from this CSV file
See this proteome in:

Proteome-pI is available under Creative Commons Attribution-NoDerivs license, for more details see here
| Reference: Kozlowski LP. Proteome-pI 2.0: Proteome Isoelectric Point Database Update. Nucleic Acids Res. 2021, doi: 10.1093/nar/gkab944 | Contact: Lukasz P. Kozlowski |