Abaca bunchy top virus
Taxonomy: Viruses; Monodnaviria; Shotokuvirae; Cressdnaviricota; Arfiviricetes; Mulpavirales; Nanoviridae; Babuvirus
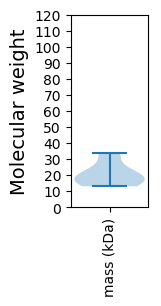
Average proteome isoelectric point is 6.78
Get precalculated fractions of proteins
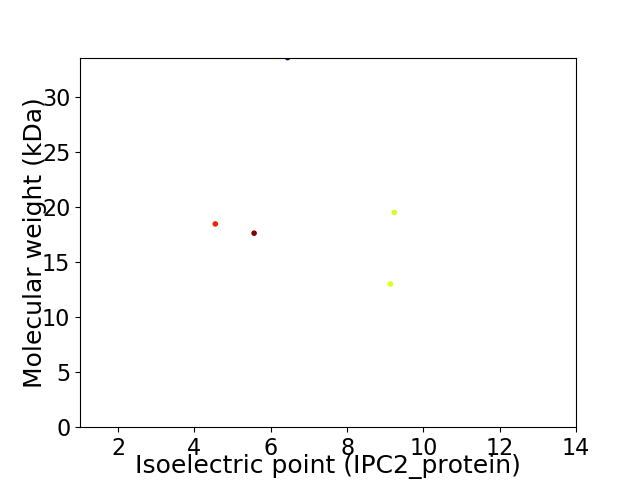
Virtual 2D-PAGE plot for 5 proteins (isoelectric point calculated using IPC2_protein)
Get csv file with sequences according to given criteria:
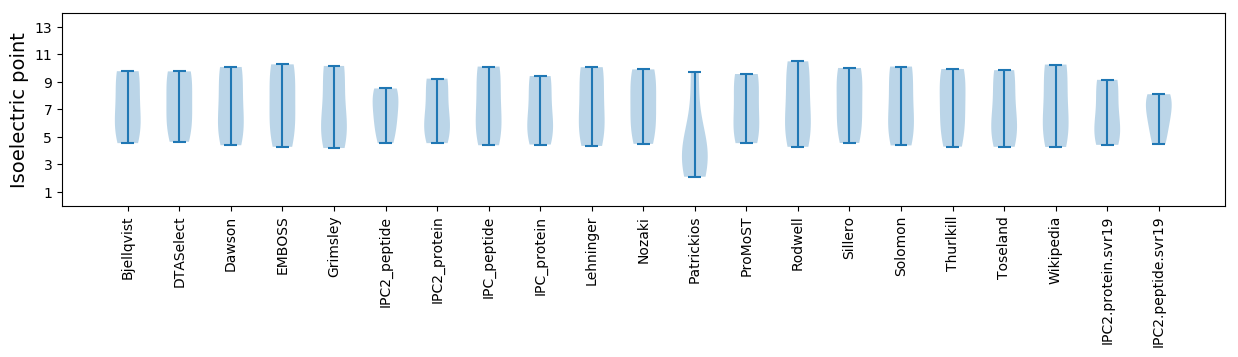
* You can choose from 21 different methods for calculating isoelectric point
Summary statistics related to proteome-wise predictions
Protein with the lowest isoelectric point:
>tr|B0LBX8|B0LBX8_9VIRU Putative replicase protein OS=Abaca bunchy top virus OX=438782 PE=3 SV=1
MM1 pKa = 7.36EE2 pKa = 5.25FWNSEE7 pKa = 4.15AFCDD11 pKa = 4.4DD12 pKa = 3.3VKK14 pKa = 11.06RR15 pKa = 11.84VIKK18 pKa = 9.97QKK20 pKa = 9.88YY21 pKa = 6.47WEE23 pKa = 4.24EE24 pKa = 3.88RR25 pKa = 11.84MKK27 pKa = 11.05SLFIEE32 pKa = 4.4KK33 pKa = 9.75VSGYY37 pKa = 7.39VRR39 pKa = 11.84RR40 pKa = 11.84ILVYY44 pKa = 10.93GNLDD48 pKa = 3.26DD49 pKa = 5.1TIYY52 pKa = 11.05AVQQMKK58 pKa = 10.02TSIVQCAEE66 pKa = 4.07RR67 pKa = 11.84FGKK70 pKa = 10.63ACVVVYY76 pKa = 10.9NGLDD80 pKa = 3.29PSIGFRR86 pKa = 11.84LHH88 pKa = 5.12TMAFFFEE95 pKa = 4.89EE96 pKa = 4.44YY97 pKa = 10.51VEE99 pKa = 4.41EE100 pKa = 4.6VSTADD105 pKa = 3.39PMAVQLFCDD114 pKa = 3.76EE115 pKa = 4.73EE116 pKa = 4.52IEE118 pKa = 4.34EE119 pKa = 4.45FSNSDD124 pKa = 2.72VRR126 pKa = 11.84LIKK129 pKa = 10.48NVIMASTDD137 pKa = 2.98ASIDD141 pKa = 3.42VGNCIQIIISDD152 pKa = 4.01NVITFYY158 pKa = 10.64ICC160 pKa = 3.93
MM1 pKa = 7.36EE2 pKa = 5.25FWNSEE7 pKa = 4.15AFCDD11 pKa = 4.4DD12 pKa = 3.3VKK14 pKa = 11.06RR15 pKa = 11.84VIKK18 pKa = 9.97QKK20 pKa = 9.88YY21 pKa = 6.47WEE23 pKa = 4.24EE24 pKa = 3.88RR25 pKa = 11.84MKK27 pKa = 11.05SLFIEE32 pKa = 4.4KK33 pKa = 9.75VSGYY37 pKa = 7.39VRR39 pKa = 11.84RR40 pKa = 11.84ILVYY44 pKa = 10.93GNLDD48 pKa = 3.26DD49 pKa = 5.1TIYY52 pKa = 11.05AVQQMKK58 pKa = 10.02TSIVQCAEE66 pKa = 4.07RR67 pKa = 11.84FGKK70 pKa = 10.63ACVVVYY76 pKa = 10.9NGLDD80 pKa = 3.29PSIGFRR86 pKa = 11.84LHH88 pKa = 5.12TMAFFFEE95 pKa = 4.89EE96 pKa = 4.44YY97 pKa = 10.51VEE99 pKa = 4.41EE100 pKa = 4.6VSTADD105 pKa = 3.39PMAVQLFCDD114 pKa = 3.76EE115 pKa = 4.73EE116 pKa = 4.52IEE118 pKa = 4.34EE119 pKa = 4.45FSNSDD124 pKa = 2.72VRR126 pKa = 11.84LIKK129 pKa = 10.48NVIMASTDD137 pKa = 2.98ASIDD141 pKa = 3.42VGNCIQIIISDD152 pKa = 4.01NVITFYY158 pKa = 10.64ICC160 pKa = 3.93
Molecular weight: 18.48 kDa
Isoelectric point according different methods:
Protein with the highest isoelectric point:
>tr|B0LBX6|B0LBX6_9VIRU Putative movement protein OS=Abaca bunchy top virus OX=438782 PE=4 SV=1
MM1 pKa = 7.47ARR3 pKa = 11.84YY4 pKa = 7.86PKK6 pKa = 10.25KK7 pKa = 10.47ALKK10 pKa = 9.65KK11 pKa = 9.15RR12 pKa = 11.84KK13 pKa = 9.18AVRR16 pKa = 11.84RR17 pKa = 11.84KK18 pKa = 9.05YY19 pKa = 10.53GSKK22 pKa = 9.24ATTSHH27 pKa = 7.45DD28 pKa = 3.87YY29 pKa = 11.28AVDD32 pKa = 3.22TSFIVPEE39 pKa = 4.09NTIKK43 pKa = 10.84LYY45 pKa = 10.62RR46 pKa = 11.84IEE48 pKa = 4.53PTDD51 pKa = 3.32KK52 pKa = 10.0TLPRR56 pKa = 11.84YY57 pKa = 8.25FIWKK61 pKa = 8.52MFMLLVCKK69 pKa = 10.16VRR71 pKa = 11.84PGRR74 pKa = 11.84ILHH77 pKa = 5.9WAMIKK82 pKa = 10.53SSWDD86 pKa = 3.3VKK88 pKa = 11.19DD89 pKa = 3.33PTVVLEE95 pKa = 4.3APGLFIKK102 pKa = 9.86PANSHH107 pKa = 5.5LVKK110 pKa = 10.42LVCSGEE116 pKa = 4.02LEE118 pKa = 4.2APVGGGTSEE127 pKa = 4.26VEE129 pKa = 3.73CLLRR133 pKa = 11.84KK134 pKa = 6.69TTLLRR139 pKa = 11.84RR140 pKa = 11.84NVTEE144 pKa = 5.47LDD146 pKa = 3.4FLYY149 pKa = 10.93LAFYY153 pKa = 10.02CSSGVTINYY162 pKa = 7.97QNRR165 pKa = 11.84ITYY168 pKa = 9.37HH169 pKa = 4.27VV170 pKa = 3.46
MM1 pKa = 7.47ARR3 pKa = 11.84YY4 pKa = 7.86PKK6 pKa = 10.25KK7 pKa = 10.47ALKK10 pKa = 9.65KK11 pKa = 9.15RR12 pKa = 11.84KK13 pKa = 9.18AVRR16 pKa = 11.84RR17 pKa = 11.84KK18 pKa = 9.05YY19 pKa = 10.53GSKK22 pKa = 9.24ATTSHH27 pKa = 7.45DD28 pKa = 3.87YY29 pKa = 11.28AVDD32 pKa = 3.22TSFIVPEE39 pKa = 4.09NTIKK43 pKa = 10.84LYY45 pKa = 10.62RR46 pKa = 11.84IEE48 pKa = 4.53PTDD51 pKa = 3.32KK52 pKa = 10.0TLPRR56 pKa = 11.84YY57 pKa = 8.25FIWKK61 pKa = 8.52MFMLLVCKK69 pKa = 10.16VRR71 pKa = 11.84PGRR74 pKa = 11.84ILHH77 pKa = 5.9WAMIKK82 pKa = 10.53SSWDD86 pKa = 3.3VKK88 pKa = 11.19DD89 pKa = 3.33PTVVLEE95 pKa = 4.3APGLFIKK102 pKa = 9.86PANSHH107 pKa = 5.5LVKK110 pKa = 10.42LVCSGEE116 pKa = 4.02LEE118 pKa = 4.2APVGGGTSEE127 pKa = 4.26VEE129 pKa = 3.73CLLRR133 pKa = 11.84KK134 pKa = 6.69TTLLRR139 pKa = 11.84RR140 pKa = 11.84NVTEE144 pKa = 5.47LDD146 pKa = 3.4FLYY149 pKa = 10.93LAFYY153 pKa = 10.02CSSGVTINYY162 pKa = 7.97QNRR165 pKa = 11.84ITYY168 pKa = 9.37HH169 pKa = 4.27VV170 pKa = 3.46
Molecular weight: 19.53 kDa
Isoelectric point according different methods:
Peptides (in silico digests for buttom-up proteomics)
Below you can find in silico digests of the whole proteome with Trypsin, Chymotrypsin, Trypsin+LysC, LysN, ArgC proteases suitable for different mass spec machines.| Try ESI |
 |
|---|
| ChTry ESI |
|
|---|
| ArgC ESI |
|
|---|
| LysN ESI |
|
|---|
| TryLysC ESI |
|
|---|
| Try MALDI |
|
|---|
| ChTry MALDI |
|
|---|
| ArgC MALDI |
|
|---|
| LysN MALDI |
|
|---|
| TryLysC MALDI |
|
|---|
| Try LTQ |
|
|---|
| ChTry LTQ |
|
|---|
| ArgC LTQ |
|
|---|
| LysN LTQ |
|
|---|
| TryLysC LTQ |
|
|---|
| Try MSlow |
|
|---|
| ChTry MSlow |
|
|---|
| ArgC MSlow |
|
|---|
| LysN MSlow |
|
|---|
| TryLysC MSlow |
|
|---|
| Try MShigh |
|
|---|
| ChTry MShigh |
|
|---|
| ArgC MShigh |
|
|---|
| LysN MShigh |
|
|---|
| TryLysC MShigh |
|
|---|
General Statistics
Number of major isoforms |
Number of additional isoforms |
Number of all proteins |
Number of amino acids |
Min. Seq. Length |
Max. Seq. Length |
Avg. Seq. Length |
Avg. Mol. Weight |
|---|---|---|---|---|---|---|---|
0 |
886 |
116 |
286 |
177.2 |
20.46 |
Amino acid frequency
Ala |
Cys |
Asp |
Glu |
Phe |
Gly |
His |
Ile |
Lys |
Leu |
|---|---|---|---|---|---|---|---|---|---|
5.079 ± 0.547 | 3.047 ± 0.538 |
4.74 ± 0.759 | 7.336 ± 1.159 |
4.628 ± 0.558 | 6.095 ± 0.716 |
1.58 ± 0.251 | 7.336 ± 0.758 |
5.982 ± 0.925 | 6.321 ± 1.205 |
Met |
Asn |
Gln |
Pro |
Arg |
Ser |
Thr |
Val |
Trp |
Tyr |
|---|---|---|---|---|---|---|---|---|---|
3.499 ± 0.39 | 4.176 ± 0.737 |
3.95 ± 0.673 | 3.273 ± 0.716 |
6.659 ± 0.548 | 5.643 ± 0.989 |
5.305 ± 0.769 | 8.126 ± 0.752 |
1.58 ± 0.102 | 5.53 ± 0.432 |
Most of the basic statistics you can see at this page can be downloaded from this CSV file
See this proteome in:

Proteome-pI is available under Creative Commons Attribution-NoDerivs license, for more details see here
| Reference: Kozlowski LP. Proteome-pI 2.0: Proteome Isoelectric Point Database Update. Nucleic Acids Res. 2021, doi: 10.1093/nar/gkab944 | Contact: Lukasz P. Kozlowski |