Edwardsiella phage MSW-3
Taxonomy: Viruses; Duplodnaviria; Heunggongvirae; Uroviricota; Caudoviricetes; Caudovirales; Myoviridae; Yokohamavirus; Edwardsiella virus MSW3
Average proteome isoelectric point is 6.41
Get precalculated fractions of proteins
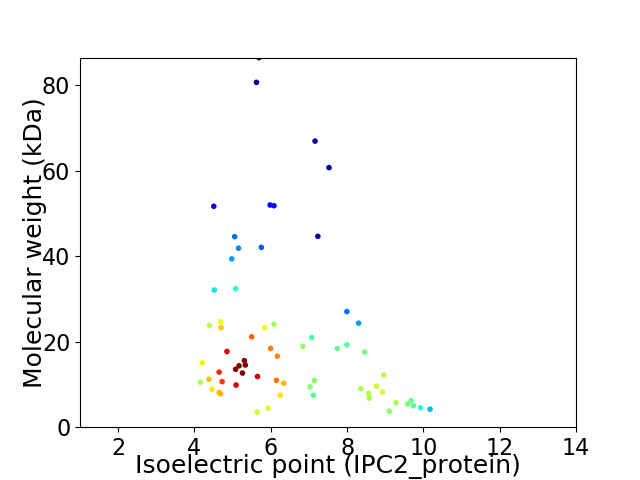
Virtual 2D-PAGE plot for 66 proteins (isoelectric point calculated using IPC2_protein)
Get csv file with sequences according to given criteria:
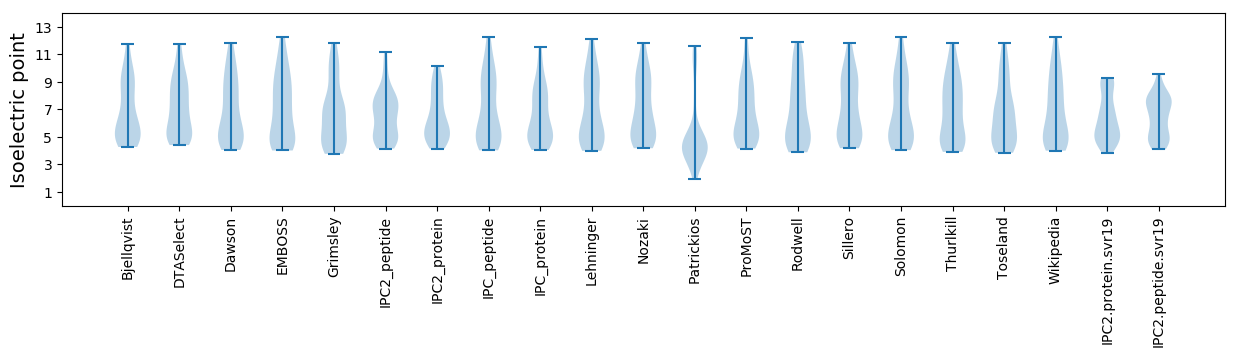
* You can choose from 21 different methods for calculating isoelectric point
Summary statistics related to proteome-wise predictions
Protein with the lowest isoelectric point:
>tr|L0MZ26|L0MZ26_9CAUD Uncharacterized protein OS=Edwardsiella phage MSW-3 OX=1264700 PE=4 SV=1
MM1 pKa = 8.44IEE3 pKa = 4.1IPLKK7 pKa = 10.65GGAANAHH14 pKa = 4.31QTFNIQLGDD23 pKa = 3.75TYY25 pKa = 11.81VDD27 pKa = 3.93FTLNYY32 pKa = 10.11VSYY35 pKa = 9.49TDD37 pKa = 3.6KK38 pKa = 10.63PAWSMDD44 pKa = 2.64ISRR47 pKa = 11.84DD48 pKa = 3.34GAPLVNGAMLEE59 pKa = 4.19PGCDD63 pKa = 3.41VIQSYY68 pKa = 9.59GAGIGKK74 pKa = 9.87LIFIGAEE81 pKa = 3.86VTLDD85 pKa = 3.55NLGTDD90 pKa = 3.25NHH92 pKa = 6.35LVWVSEE98 pKa = 4.08
MM1 pKa = 8.44IEE3 pKa = 4.1IPLKK7 pKa = 10.65GGAANAHH14 pKa = 4.31QTFNIQLGDD23 pKa = 3.75TYY25 pKa = 11.81VDD27 pKa = 3.93FTLNYY32 pKa = 10.11VSYY35 pKa = 9.49TDD37 pKa = 3.6KK38 pKa = 10.63PAWSMDD44 pKa = 2.64ISRR47 pKa = 11.84DD48 pKa = 3.34GAPLVNGAMLEE59 pKa = 4.19PGCDD63 pKa = 3.41VIQSYY68 pKa = 9.59GAGIGKK74 pKa = 9.87LIFIGAEE81 pKa = 3.86VTLDD85 pKa = 3.55NLGTDD90 pKa = 3.25NHH92 pKa = 6.35LVWVSEE98 pKa = 4.08
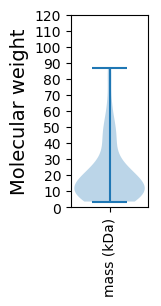
Molecular weight: 10.55 kDa
Isoelectric point according different methods:
Protein with the highest isoelectric point:
>tr|L0MZ40|L0MZ40_9CAUD Uncharacterized protein OS=Edwardsiella phage MSW-3 OX=1264700 PE=4 SV=1
MM1 pKa = 7.12TRR3 pKa = 11.84AKK5 pKa = 10.39SRR7 pKa = 11.84EE8 pKa = 3.83KK9 pKa = 10.25LTVGVRR15 pKa = 11.84NNKK18 pKa = 8.24VRR20 pKa = 11.84NSTDD24 pKa = 2.86GMVHH28 pKa = 6.32SFIFPFTANQNLMSAGGTRR47 pKa = 11.84CEE49 pKa = 3.97
MM1 pKa = 7.12TRR3 pKa = 11.84AKK5 pKa = 10.39SRR7 pKa = 11.84EE8 pKa = 3.83KK9 pKa = 10.25LTVGVRR15 pKa = 11.84NNKK18 pKa = 8.24VRR20 pKa = 11.84NSTDD24 pKa = 2.86GMVHH28 pKa = 6.32SFIFPFTANQNLMSAGGTRR47 pKa = 11.84CEE49 pKa = 3.97
Molecular weight: 5.46 kDa
Isoelectric point according different methods:
Peptides (in silico digests for buttom-up proteomics)
Below you can find in silico digests of the whole proteome with Trypsin, Chymotrypsin, Trypsin+LysC, LysN, ArgC proteases suitable for different mass spec machines.| Try ESI |
 |
|---|
| ChTry ESI |
|
|---|
| ArgC ESI |
|
|---|
| LysN ESI |
|
|---|
| TryLysC ESI |
|
|---|
| Try MALDI |
|
|---|
| ChTry MALDI |
|
|---|
| ArgC MALDI |
|
|---|
| LysN MALDI |
|
|---|
| TryLysC MALDI |
|
|---|
| Try LTQ |
|
|---|
| ChTry LTQ |
|
|---|
| ArgC LTQ |
|
|---|
| LysN LTQ |
|
|---|
| TryLysC LTQ |
|
|---|
| Try MSlow |
|
|---|
| ChTry MSlow |
|
|---|
| ArgC MSlow |
|
|---|
| LysN MSlow |
|
|---|
| TryLysC MSlow |
|
|---|
| Try MShigh |
|
|---|
| ChTry MShigh |
|
|---|
| ArgC MShigh |
|
|---|
| LysN MShigh |
|
|---|
| TryLysC MShigh |
|
|---|
General Statistics
Number of major isoforms |
Number of additional isoforms |
Number of all proteins |
Number of amino acids |
Min. Seq. Length |
Max. Seq. Length |
Avg. Seq. Length |
Avg. Mol. Weight |
|---|---|---|---|---|---|---|---|
0 |
12662 |
31 |
782 |
191.8 |
21.18 |
Amino acid frequency
Ala |
Cys |
Asp |
Glu |
Phe |
Gly |
His |
Ile |
Lys |
Leu |
|---|---|---|---|---|---|---|---|---|---|
9.872 ± 0.558 | 1.406 ± 0.138 |
6.531 ± 0.258 | 5.457 ± 0.23 |
3.467 ± 0.186 | 7.7 ± 0.308 |
1.864 ± 0.182 | 5.189 ± 0.189 |
4.754 ± 0.181 | 7.195 ± 0.285 |
Met |
Asn |
Gln |
Pro |
Arg |
Ser |
Thr |
Val |
Trp |
Tyr |
|---|---|---|---|---|---|---|---|---|---|
2.97 ± 0.145 | 4.454 ± 0.237 |
4.415 ± 0.298 | 3.609 ± 0.214 |
6.192 ± 0.271 | 5.994 ± 0.265 |
6.413 ± 0.335 | 7.692 ± 0.326 |
1.627 ± 0.148 | 3.199 ± 0.209 |
Most of the basic statistics you can see at this page can be downloaded from this CSV file
See this proteome in:

Proteome-pI is available under Creative Commons Attribution-NoDerivs license, for more details see here
| Reference: Kozlowski LP. Proteome-pI 2.0: Proteome Isoelectric Point Database Update. Nucleic Acids Res. 2021, doi: 10.1093/nar/gkab944 | Contact: Lukasz P. Kozlowski |