Sphingomonas spermidinifaciens
Taxonomy: cellular organisms; Bacteria; Proteobacteria; Alphaproteobacteria; Sphingomonadales; Sphingomonadaceae; Sphingomonas
Average proteome isoelectric point is 6.7
Get precalculated fractions of proteins
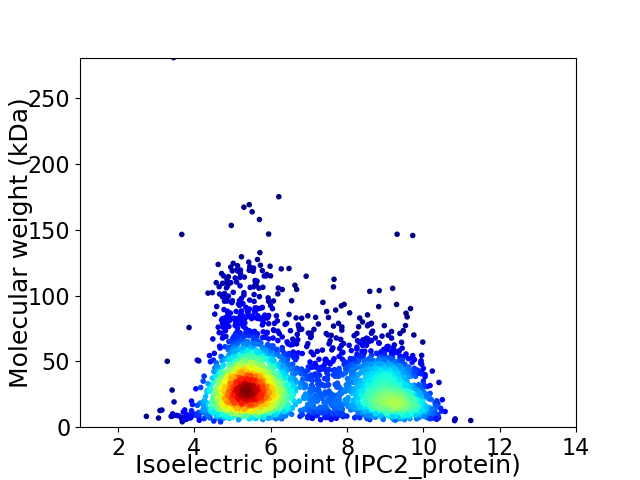
Virtual 2D-PAGE plot for 3376 proteins (isoelectric point calculated using IPC2_protein)
Get csv file with sequences according to given criteria:
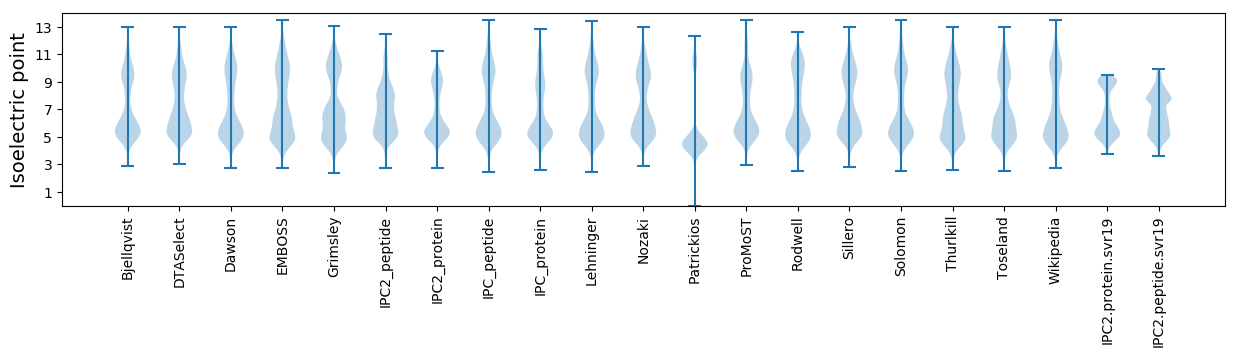
* You can choose from 21 different methods for calculating isoelectric point
Summary statistics related to proteome-wise predictions
Protein with the lowest isoelectric point:
>tr|A0A2A4B2X2|A0A2A4B2X2_9SPHN MFS transporter OS=Sphingomonas spermidinifaciens OX=1141889 GN=COC42_11685 PE=4 SV=1
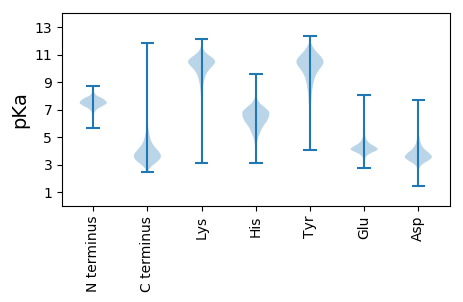
MM1 pKa = 7.56KK2 pKa = 10.31SRR4 pKa = 11.84YY5 pKa = 8.93FLALPPIALLAACGGGASTDD25 pKa = 3.54QTATTTNTGNVILNDD40 pKa = 3.36AQANYY45 pKa = 10.59SFEE48 pKa = 3.93NDD50 pKa = 3.69AILNTTADD58 pKa = 3.87DD59 pKa = 3.85AAAMNAAPANGMM71 pKa = 3.94
MM1 pKa = 7.56KK2 pKa = 10.31SRR4 pKa = 11.84YY5 pKa = 8.93FLALPPIALLAACGGGASTDD25 pKa = 3.54QTATTTNTGNVILNDD40 pKa = 3.36AQANYY45 pKa = 10.59SFEE48 pKa = 3.93NDD50 pKa = 3.69AILNTTADD58 pKa = 3.87DD59 pKa = 3.85AAAMNAAPANGMM71 pKa = 3.94
Molecular weight: 7.19 kDa
Isoelectric point according different methods:
Protein with the highest isoelectric point:
>tr|A0A2A4BAG9|A0A2A4BAG9_9SPHN 6-phosphogluconate dehydrogenase OS=Sphingomonas spermidinifaciens OX=1141889 GN=COC42_01735 PE=4 SV=1
MM1 pKa = 7.45KK2 pKa = 9.61RR3 pKa = 11.84TFQPSNLVRR12 pKa = 11.84ARR14 pKa = 11.84RR15 pKa = 11.84HH16 pKa = 4.82GFFARR21 pKa = 11.84MATAAGRR28 pKa = 11.84KK29 pKa = 8.9VIRR32 pKa = 11.84ARR34 pKa = 11.84RR35 pKa = 11.84ARR37 pKa = 11.84GRR39 pKa = 11.84KK40 pKa = 9.02KK41 pKa = 10.61LSAA44 pKa = 4.03
MM1 pKa = 7.45KK2 pKa = 9.61RR3 pKa = 11.84TFQPSNLVRR12 pKa = 11.84ARR14 pKa = 11.84RR15 pKa = 11.84HH16 pKa = 4.82GFFARR21 pKa = 11.84MATAAGRR28 pKa = 11.84KK29 pKa = 8.9VIRR32 pKa = 11.84ARR34 pKa = 11.84RR35 pKa = 11.84ARR37 pKa = 11.84GRR39 pKa = 11.84KK40 pKa = 9.02KK41 pKa = 10.61LSAA44 pKa = 4.03
Molecular weight: 5.08 kDa
Isoelectric point according different methods:
Peptides (in silico digests for buttom-up proteomics)
Below you can find in silico digests of the whole proteome with Trypsin, Chymotrypsin, Trypsin+LysC, LysN, ArgC proteases suitable for different mass spec machines.| Try ESI |
 |
|---|
| ChTry ESI |
|
|---|
| ArgC ESI |
|
|---|
| LysN ESI |
|
|---|
| TryLysC ESI |
|
|---|
| Try MALDI |
|
|---|
| ChTry MALDI |
|
|---|
| ArgC MALDI |
|
|---|
| LysN MALDI |
|
|---|
| TryLysC MALDI |
|
|---|
| Try LTQ |
|
|---|
| ChTry LTQ |
|
|---|
| ArgC LTQ |
|
|---|
| LysN LTQ |
|
|---|
| TryLysC LTQ |
|
|---|
| Try MSlow |
|
|---|
| ChTry MSlow |
|
|---|
| ArgC MSlow |
|
|---|
| LysN MSlow |
|
|---|
| TryLysC MSlow |
|
|---|
| Try MShigh |
|
|---|
| ChTry MShigh |
|
|---|
| ArgC MShigh |
|
|---|
| LysN MShigh |
|
|---|
| TryLysC MShigh |
|
|---|
General Statistics
Number of major isoforms |
Number of additional isoforms |
Number of all proteins |
Number of amino acids |
Min. Seq. Length |
Max. Seq. Length |
Avg. Seq. Length |
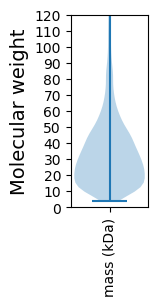
Avg. Mol. Weight |
|---|---|---|---|---|---|---|---|
0 |
1098682 |
37 |
2938 |
325.4 |
34.98 |
Amino acid frequency
Ala |
Cys |
Asp |
Glu |
Phe |
Gly |
His |
Ile |
Lys |
Leu |
|---|---|---|---|---|---|---|---|---|---|
14.452 ± 0.071 | 0.704 ± 0.011 |
5.901 ± 0.031 | 5.438 ± 0.039 |
3.443 ± 0.031 | 9.179 ± 0.039 |
1.843 ± 0.019 | 4.677 ± 0.028 |
2.514 ± 0.034 | 9.884 ± 0.046 |
Met |
Asn |
Gln |
Pro |
Arg |
Ser |
Thr |
Val |
Trp |
Tyr |
|---|---|---|---|---|---|---|---|---|---|
2.245 ± 0.023 | 2.276 ± 0.031 |
5.595 ± 0.037 | 2.842 ± 0.023 |
8.021 ± 0.051 | 4.741 ± 0.034 |
5.242 ± 0.037 | 7.465 ± 0.033 |
1.444 ± 0.016 | 2.093 ± 0.023 |
Most of the basic statistics you can see at this page can be downloaded from this CSV file
See this proteome in:

Proteome-pI is available under Creative Commons Attribution-NoDerivs license, for more details see here
| Reference: Kozlowski LP. Proteome-pI 2.0: Proteome Isoelectric Point Database Update. Nucleic Acids Res. 2021, doi: 10.1093/nar/gkab944 | Contact: Lukasz P. Kozlowski |