Yersinia phage phiYeO3-12
Taxonomy: Viruses; Duplodnaviria; Heunggongvirae; Uroviricota; Caudoviricetes; Caudovirales; Autographiviridae; Studiervirinae; Teetrevirus; Yersinia virus YeO3-12
Average proteome isoelectric point is 7.07
Get precalculated fractions of proteins
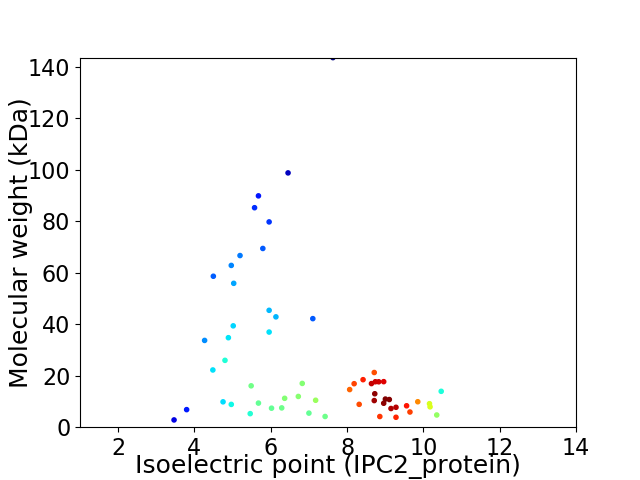
Virtual 2D-PAGE plot for 59 proteins (isoelectric point calculated using IPC2_protein)
Get csv file with sequences according to given criteria:
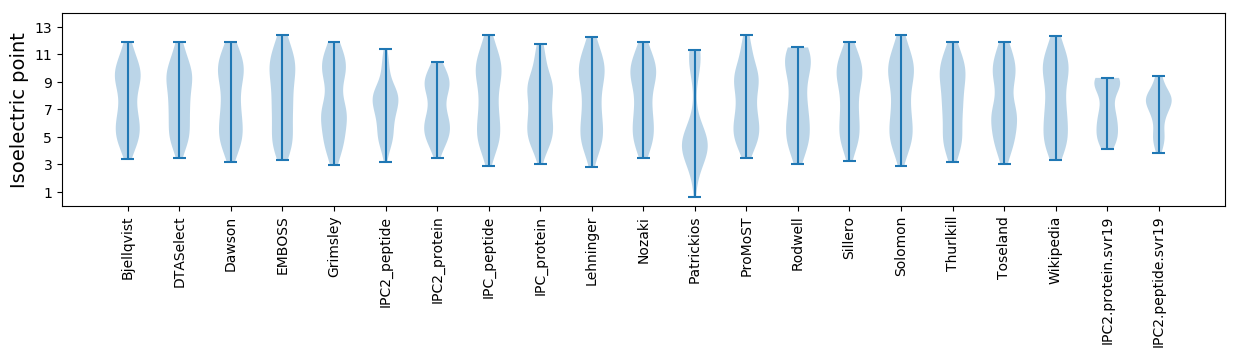
* You can choose from 21 different methods for calculating isoelectric point
Summary statistics related to proteome-wise predictions
Protein with the lowest isoelectric point:
>tr|Q9FZX9|Q9FZX9_9CAUD Putative 0.45 protein OS=Yersinia phage phiYeO3-12 OX=110457 GN=0.45 PE=4 SV=1
MM1 pKa = 7.73IMPKK5 pKa = 10.08SDD7 pKa = 3.6TVTMTRR13 pKa = 11.84DD14 pKa = 2.64AWNDD18 pKa = 2.85VSAYY22 pKa = 9.32IDD24 pKa = 3.7KK25 pKa = 11.04LEE27 pKa = 4.85KK28 pKa = 10.7DD29 pKa = 4.0LEE31 pKa = 4.14FLNALKK37 pKa = 10.74ACGVDD42 pKa = 3.06NWDD45 pKa = 3.98GYY47 pKa = 10.81SDD49 pKa = 4.02AVEE52 pKa = 4.1MVYY55 pKa = 11.01GEE57 pKa = 4.71DD58 pKa = 4.8DD59 pKa = 3.52EE60 pKa = 5.21
MM1 pKa = 7.73IMPKK5 pKa = 10.08SDD7 pKa = 3.6TVTMTRR13 pKa = 11.84DD14 pKa = 2.64AWNDD18 pKa = 2.85VSAYY22 pKa = 9.32IDD24 pKa = 3.7KK25 pKa = 11.04LEE27 pKa = 4.85KK28 pKa = 10.7DD29 pKa = 4.0LEE31 pKa = 4.14FLNALKK37 pKa = 10.74ACGVDD42 pKa = 3.06NWDD45 pKa = 3.98GYY47 pKa = 10.81SDD49 pKa = 4.02AVEE52 pKa = 4.1MVYY55 pKa = 11.01GEE57 pKa = 4.71DD58 pKa = 4.8DD59 pKa = 3.52EE60 pKa = 5.21
Molecular weight: 6.83 kDa
Isoelectric point according different methods:
Protein with the highest isoelectric point:
>tr|Q9T0Z4|Q9T0Z4_9CAUD Terminase large subunit OS=Yersinia phage phiYeO3-12 OX=110457 GN=19 PE=3 SV=1
MM1 pKa = 7.39GTPQSSGLRR10 pKa = 11.84SIRR13 pKa = 11.84VAVRR17 pKa = 11.84KK18 pKa = 7.11TCTMATVWPRR28 pKa = 11.84CSAKK32 pKa = 10.38SSTMGSRR39 pKa = 11.84CSKK42 pKa = 10.41VNRR45 pKa = 11.84LTPCASIWKK54 pKa = 7.91TCVSVSWNTVRR65 pKa = 11.84LASLCSSCSTRR76 pKa = 11.84TT77 pKa = 3.28
MM1 pKa = 7.39GTPQSSGLRR10 pKa = 11.84SIRR13 pKa = 11.84VAVRR17 pKa = 11.84KK18 pKa = 7.11TCTMATVWPRR28 pKa = 11.84CSAKK32 pKa = 10.38SSTMGSRR39 pKa = 11.84CSKK42 pKa = 10.41VNRR45 pKa = 11.84LTPCASIWKK54 pKa = 7.91TCVSVSWNTVRR65 pKa = 11.84LASLCSSCSTRR76 pKa = 11.84TT77 pKa = 3.28
Molecular weight: 8.32 kDa
Isoelectric point according different methods:
Peptides (in silico digests for buttom-up proteomics)
Below you can find in silico digests of the whole proteome with Trypsin, Chymotrypsin, Trypsin+LysC, LysN, ArgC proteases suitable for different mass spec machines.| Try ESI |
 |
|---|
| ChTry ESI |
|
|---|
| ArgC ESI |
|
|---|
| LysN ESI |
|
|---|
| TryLysC ESI |
|
|---|
| Try MALDI |
|
|---|
| ChTry MALDI |
|
|---|
| ArgC MALDI |
|
|---|
| LysN MALDI |
|
|---|
| TryLysC MALDI |
|
|---|
| Try LTQ |
|
|---|
| ChTry LTQ |
|
|---|
| ArgC LTQ |
|
|---|
| LysN LTQ |
|
|---|
| TryLysC LTQ |
|
|---|
| Try MSlow |
|
|---|
| ChTry MSlow |
|
|---|
| ArgC MSlow |
|
|---|
| LysN MSlow |
|
|---|
| TryLysC MSlow |
|
|---|
| Try MShigh |
|
|---|
| ChTry MShigh |
|
|---|
| ArgC MShigh |
|
|---|
| LysN MShigh |
|
|---|
| TryLysC MShigh |
|
|---|
General Statistics
Number of major isoforms |
Number of additional isoforms |
Number of all proteins |
Number of amino acids |
Min. Seq. Length |
Max. Seq. Length |
Avg. Seq. Length |
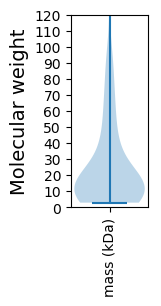
Avg. Mol. Weight |
|---|---|---|---|---|---|---|---|
0 |
13951 |
25 |
1320 |
236.5 |
26.37 |
Amino acid frequency
Ala |
Cys |
Asp |
Glu |
Phe |
Gly |
His |
Ile |
Lys |
Leu |
|---|---|---|---|---|---|---|---|---|---|
9.354 ± 0.472 | 1.19 ± 0.229 |
6.107 ± 0.29 | 6.924 ± 0.335 |
3.512 ± 0.213 | 7.648 ± 0.321 |
2.014 ± 0.177 | 5.096 ± 0.176 |
6.645 ± 0.359 | 8.128 ± 0.313 |
Met |
Asn |
Gln |
Pro |
Arg |
Ser |
Thr |
Val |
Trp |
Tyr |
|---|---|---|---|---|---|---|---|---|---|
2.874 ± 0.173 | 4.322 ± 0.313 |
3.598 ± 0.225 | 3.957 ± 0.3 |
5.964 ± 0.254 | 5.878 ± 0.345 |
5.512 ± 0.277 | 6.573 ± 0.272 |
1.555 ± 0.172 | 3.147 ± 0.172 |
Most of the basic statistics you can see at this page can be downloaded from this CSV file
See this proteome in:

Proteome-pI is available under Creative Commons Attribution-NoDerivs license, for more details see here
| Reference: Kozlowski LP. Proteome-pI 2.0: Proteome Isoelectric Point Database Update. Nucleic Acids Res. 2021, doi: 10.1093/nar/gkab944 | Contact: Lukasz P. Kozlowski |