Rhizobium phage vB_RglS_P106B
Taxonomy: Viruses; Duplodnaviria; Heunggongvirae; Uroviricota; Caudoviricetes; Caudovirales; Siphoviridae; Rigallicvirus; Rhizobium virus P106B
Average proteome isoelectric point is 6.58
Get precalculated fractions of proteins
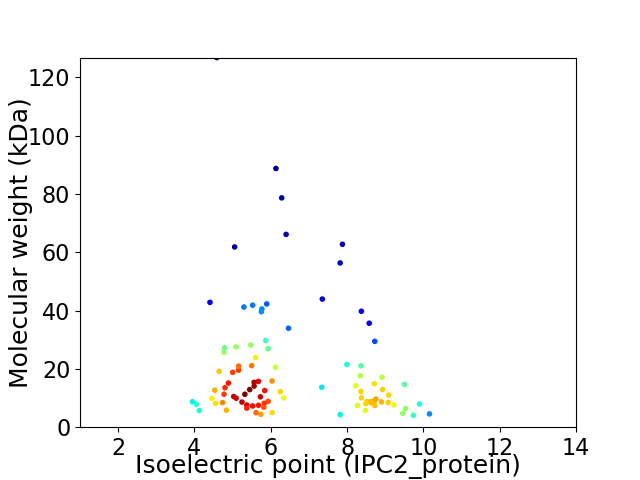
Virtual 2D-PAGE plot for 95 proteins (isoelectric point calculated using IPC2_protein)
Get csv file with sequences according to given criteria:
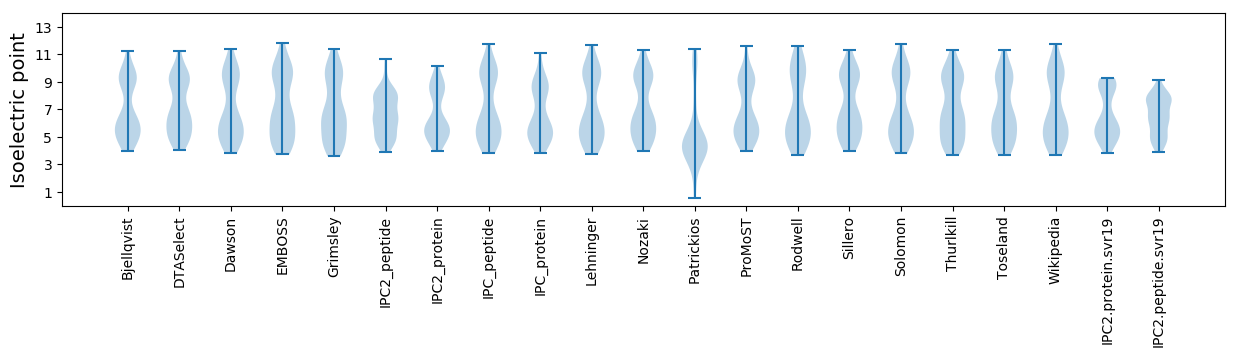
* You can choose from 21 different methods for calculating isoelectric point
Summary statistics related to proteome-wise predictions

Protein with the lowest isoelectric point:
>tr|W6E8N4|W6E8N4_9CAUD Uncharacterized protein OS=Rhizobium phage vB_RglS_P106B OX=1458697 GN=P106B_61 PE=4 SV=1
MM1 pKa = 6.96KK2 pKa = 9.51TVAEE6 pKa = 4.1IAEE9 pKa = 4.43EE10 pKa = 4.4LRR12 pKa = 11.84GTCQTLTIVLEE23 pKa = 4.29NNDD26 pKa = 4.09MDD28 pKa = 5.79GMDD31 pKa = 4.29NDD33 pKa = 4.25AAFCAEE39 pKa = 4.13LDD41 pKa = 3.81SLVFCCEE48 pKa = 3.75RR49 pKa = 11.84CDD51 pKa = 3.17WWHH54 pKa = 6.16EE55 pKa = 3.86QSEE58 pKa = 4.4MSDD61 pKa = 3.53KK62 pKa = 10.96FEE64 pKa = 3.83AWICEE69 pKa = 3.94EE70 pKa = 4.4CASEE74 pKa = 4.09VHH76 pKa = 6.56
MM1 pKa = 6.96KK2 pKa = 9.51TVAEE6 pKa = 4.1IAEE9 pKa = 4.43EE10 pKa = 4.4LRR12 pKa = 11.84GTCQTLTIVLEE23 pKa = 4.29NNDD26 pKa = 4.09MDD28 pKa = 5.79GMDD31 pKa = 4.29NDD33 pKa = 4.25AAFCAEE39 pKa = 4.13LDD41 pKa = 3.81SLVFCCEE48 pKa = 3.75RR49 pKa = 11.84CDD51 pKa = 3.17WWHH54 pKa = 6.16EE55 pKa = 3.86QSEE58 pKa = 4.4MSDD61 pKa = 3.53KK62 pKa = 10.96FEE64 pKa = 3.83AWICEE69 pKa = 3.94EE70 pKa = 4.4CASEE74 pKa = 4.09VHH76 pKa = 6.56
Molecular weight: 8.73 kDa
Isoelectric point according different methods:
Protein with the highest isoelectric point:
>tr|W6EKE2|W6EKE2_9CAUD Lysophospholipase L1-like esterase OS=Rhizobium phage vB_RglS_P106B OX=1458697 GN=P106B_13 PE=4 SV=1
MM1 pKa = 8.0DD2 pKa = 5.5RR3 pKa = 11.84GALDD7 pKa = 4.09RR8 pKa = 11.84MIKK11 pKa = 9.47TKK13 pKa = 10.52ISFSTGALAFSPNARR28 pKa = 11.84AANQKK33 pKa = 10.77ALINAA38 pKa = 4.6
MM1 pKa = 8.0DD2 pKa = 5.5RR3 pKa = 11.84GALDD7 pKa = 4.09RR8 pKa = 11.84MIKK11 pKa = 9.47TKK13 pKa = 10.52ISFSTGALAFSPNARR28 pKa = 11.84AANQKK33 pKa = 10.77ALINAA38 pKa = 4.6
Molecular weight: 4.05 kDa
Isoelectric point according different methods:
Peptides (in silico digests for buttom-up proteomics)
Below you can find in silico digests of the whole proteome with Trypsin, Chymotrypsin, Trypsin+LysC, LysN, ArgC proteases suitable for different mass spec machines.| Try ESI |
 |
|---|
| ChTry ESI |
|
|---|
| ArgC ESI |
|
|---|
| LysN ESI |
|
|---|
| TryLysC ESI |
|
|---|
| Try MALDI |
|
|---|
| ChTry MALDI |
|
|---|
| ArgC MALDI |
|
|---|
| LysN MALDI |
|
|---|
| TryLysC MALDI |
|
|---|
| Try LTQ |
|
|---|
| ChTry LTQ |
|
|---|
| ArgC LTQ |
|
|---|
| LysN LTQ |
|
|---|
| TryLysC LTQ |
|
|---|
| Try MSlow |
|
|---|
| ChTry MSlow |
|
|---|
| ArgC MSlow |
|
|---|
| LysN MSlow |
|
|---|
| TryLysC MSlow |
|
|---|
| Try MShigh |
|
|---|
| ChTry MShigh |
|
|---|
| ArgC MShigh |
|
|---|
| LysN MShigh |
|
|---|
| TryLysC MShigh |
|
|---|
General Statistics
Number of major isoforms |
Number of additional isoforms |
Number of all proteins |
Number of amino acids |
Min. Seq. Length |
Max. Seq. Length |
Avg. Seq. Length |
Avg. Mol. Weight |
|---|---|---|---|---|---|---|---|
0 |
17376 |
38 |
1172 |
182.9 |
20.28 |
Amino acid frequency
Ala |
Cys |
Asp |
Glu |
Phe |
Gly |
His |
Ile |
Lys |
Leu |
|---|---|---|---|---|---|---|---|---|---|
9.841 ± 0.314 | 1.007 ± 0.124 |
5.795 ± 0.207 | 5.928 ± 0.351 |
3.856 ± 0.164 | 7.712 ± 0.377 |
1.732 ± 0.156 | 6.371 ± 0.192 |
5.243 ± 0.267 | 7.234 ± 0.227 |
Met |
Asn |
Gln |
Pro |
Arg |
Ser |
Thr |
Val |
Trp |
Tyr |
|---|---|---|---|---|---|---|---|---|---|
2.624 ± 0.171 | 5.001 ± 0.182 |
4.639 ± 0.259 | 4.023 ± 0.262 |
5.64 ± 0.305 | 5.479 ± 0.24 |
6.474 ± 0.373 | 6.4 ± 0.3 |
1.784 ± 0.124 | 3.217 ± 0.176 |
Most of the basic statistics you can see at this page can be downloaded from this CSV file
See this proteome in:

Proteome-pI is available under Creative Commons Attribution-NoDerivs license, for more details see here
| Reference: Kozlowski LP. Proteome-pI 2.0: Proteome Isoelectric Point Database Update. Nucleic Acids Res. 2021, doi: 10.1093/nar/gkab944 | Contact: Lukasz P. Kozlowski |