Paenibacillus phage PG1
Taxonomy: Viruses; Duplodnaviria; Heunggongvirae; Uroviricota; Caudoviricetes; Caudovirales; Siphoviridae; unclassified Siphoviridae
Average proteome isoelectric point is 5.97
Get precalculated fractions of proteins
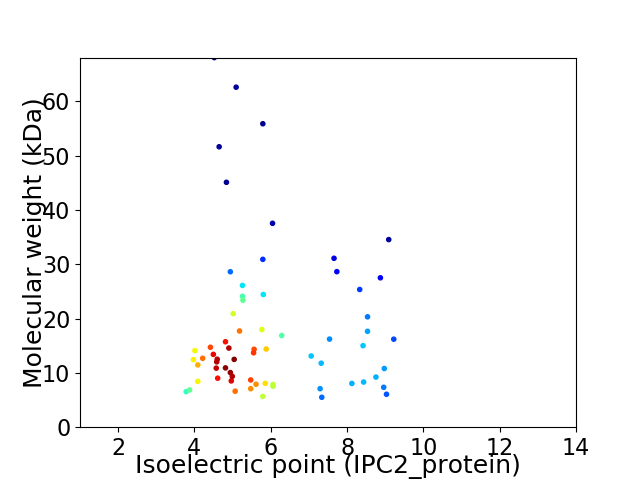
Virtual 2D-PAGE plot for 67 proteins (isoelectric point calculated using IPC2_protein)
Get csv file with sequences according to given criteria:
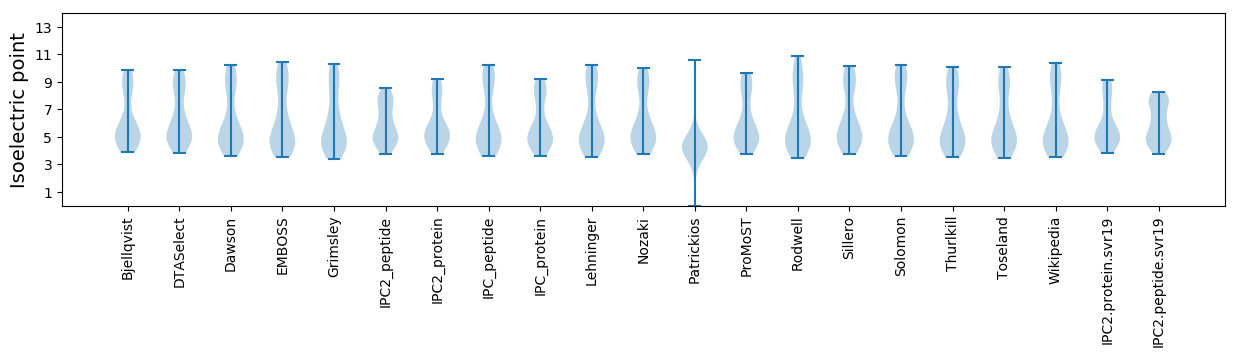
* You can choose from 21 different methods for calculating isoelectric point
Summary statistics related to proteome-wise predictions
Protein with the lowest isoelectric point:
>tr|R9TLQ8|R9TLQ8_9CAUD Uncharacterized protein OS=Paenibacillus phage PG1 OX=754053 GN=PANG_00049 PE=4 SV=1
MM1 pKa = 7.11NVKK4 pKa = 9.97EE5 pKa = 4.28LIEE8 pKa = 4.3RR9 pKa = 11.84LSGYY13 pKa = 10.51DD14 pKa = 4.13DD15 pKa = 4.55EE16 pKa = 6.65IEE18 pKa = 4.27VKK20 pKa = 10.54FGIWNPEE27 pKa = 3.51TCEE30 pKa = 4.09AEE32 pKa = 4.04EE33 pKa = 4.18TFPINDD39 pKa = 3.56VNPYY43 pKa = 10.8DD44 pKa = 3.81YY45 pKa = 10.87LDD47 pKa = 3.83PVLYY51 pKa = 9.86IWSEE55 pKa = 3.85
MM1 pKa = 7.11NVKK4 pKa = 9.97EE5 pKa = 4.28LIEE8 pKa = 4.3RR9 pKa = 11.84LSGYY13 pKa = 10.51DD14 pKa = 4.13DD15 pKa = 4.55EE16 pKa = 6.65IEE18 pKa = 4.27VKK20 pKa = 10.54FGIWNPEE27 pKa = 3.51TCEE30 pKa = 4.09AEE32 pKa = 4.04EE33 pKa = 4.18TFPINDD39 pKa = 3.56VNPYY43 pKa = 10.8DD44 pKa = 3.81YY45 pKa = 10.87LDD47 pKa = 3.83PVLYY51 pKa = 9.86IWSEE55 pKa = 3.85
Molecular weight: 6.54 kDa
Isoelectric point according different methods:
Protein with the highest isoelectric point:
>tr|R9TQ42|R9TQ42_9CAUD Uncharacterized protein OS=Paenibacillus phage PG1 OX=754053 GN=PANG_00063 PE=4 SV=1
MM1 pKa = 7.4IKK3 pKa = 10.42KK4 pKa = 9.24LICALIGHH12 pKa = 7.29RR13 pKa = 11.84WAQHH17 pKa = 5.31TYY19 pKa = 9.37VQGNTYY25 pKa = 8.75TGKK28 pKa = 9.84HH29 pKa = 5.14CWRR32 pKa = 11.84CKK34 pKa = 10.26KK35 pKa = 10.33GLPANAHH42 pKa = 6.38IYY44 pKa = 9.62MEE46 pKa = 3.73IRR48 pKa = 11.84RR49 pKa = 11.84NKK51 pKa = 10.4DD52 pKa = 3.2HH53 pKa = 7.29INLPGEE59 pKa = 4.21EE60 pKa = 4.24TTVV63 pKa = 3.01
MM1 pKa = 7.4IKK3 pKa = 10.42KK4 pKa = 9.24LICALIGHH12 pKa = 7.29RR13 pKa = 11.84WAQHH17 pKa = 5.31TYY19 pKa = 9.37VQGNTYY25 pKa = 8.75TGKK28 pKa = 9.84HH29 pKa = 5.14CWRR32 pKa = 11.84CKK34 pKa = 10.26KK35 pKa = 10.33GLPANAHH42 pKa = 6.38IYY44 pKa = 9.62MEE46 pKa = 3.73IRR48 pKa = 11.84RR49 pKa = 11.84NKK51 pKa = 10.4DD52 pKa = 3.2HH53 pKa = 7.29INLPGEE59 pKa = 4.21EE60 pKa = 4.24TTVV63 pKa = 3.01
Molecular weight: 7.35 kDa
Isoelectric point according different methods:
Peptides (in silico digests for buttom-up proteomics)
Below you can find in silico digests of the whole proteome with Trypsin, Chymotrypsin, Trypsin+LysC, LysN, ArgC proteases suitable for different mass spec machines.| Try ESI |
 |
|---|
| ChTry ESI |
|
|---|
| ArgC ESI |
|
|---|
| LysN ESI |
|
|---|
| TryLysC ESI |
|
|---|
| Try MALDI |
|
|---|
| ChTry MALDI |
|
|---|
| ArgC MALDI |
|
|---|
| LysN MALDI |
|
|---|
| TryLysC MALDI |
|
|---|
| Try LTQ |
|
|---|
| ChTry LTQ |
|
|---|
| ArgC LTQ |
|
|---|
| LysN LTQ |
|
|---|
| TryLysC LTQ |
|
|---|
| Try MSlow |
|
|---|
| ChTry MSlow |
|
|---|
| ArgC MSlow |
|
|---|
| LysN MSlow |
|
|---|
| TryLysC MSlow |
|
|---|
| Try MShigh |
|
|---|
| ChTry MShigh |
|
|---|
| ArgC MShigh |
|
|---|
| LysN MShigh |
|
|---|
| TryLysC MShigh |
|
|---|
General Statistics
Number of major isoforms |
Number of additional isoforms |
Number of all proteins |
Number of amino acids |
Min. Seq. Length |
Max. Seq. Length |
Avg. Seq. Length |
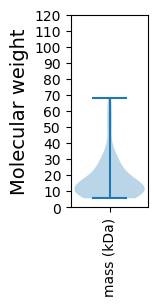
Avg. Mol. Weight |
|---|---|---|---|---|---|---|---|
0 |
10597 |
49 |
617 |
158.2 |
17.91 |
Amino acid frequency
Ala |
Cys |
Asp |
Glu |
Phe |
Gly |
His |
Ile |
Lys |
Leu |
|---|---|---|---|---|---|---|---|---|---|
6.983 ± 0.387 | 0.934 ± 0.147 |
6.209 ± 0.235 | 8.314 ± 0.499 |
3.718 ± 0.249 | 6.936 ± 0.341 |
1.689 ± 0.208 | 7.002 ± 0.314 |
7.455 ± 0.368 | 7.757 ± 0.319 |
Met |
Asn |
Gln |
Pro |
Arg |
Ser |
Thr |
Val |
Trp |
Tyr |
|---|---|---|---|---|---|---|---|---|---|
2.803 ± 0.182 | 5.294 ± 0.272 |
3.246 ± 0.192 | 3.907 ± 0.263 |
4.662 ± 0.278 | 5.643 ± 0.249 |
5.407 ± 0.342 | 6.568 ± 0.27 |
1.529 ± 0.164 | 3.945 ± 0.242 |
Most of the basic statistics you can see at this page can be downloaded from this CSV file
See this proteome in:

Proteome-pI is available under Creative Commons Attribution-NoDerivs license, for more details see here
| Reference: Kozlowski LP. Proteome-pI 2.0: Proteome Isoelectric Point Database Update. Nucleic Acids Res. 2021, doi: 10.1093/nar/gkab944 | Contact: Lukasz P. Kozlowski |