Bacillus phage Anath
Taxonomy: Viruses; Duplodnaviria; Heunggongvirae; Uroviricota; Caudoviricetes; Caudovirales; Siphoviridae; unclassified Siphoviridae
Average proteome isoelectric point is 6.52
Get precalculated fractions of proteins
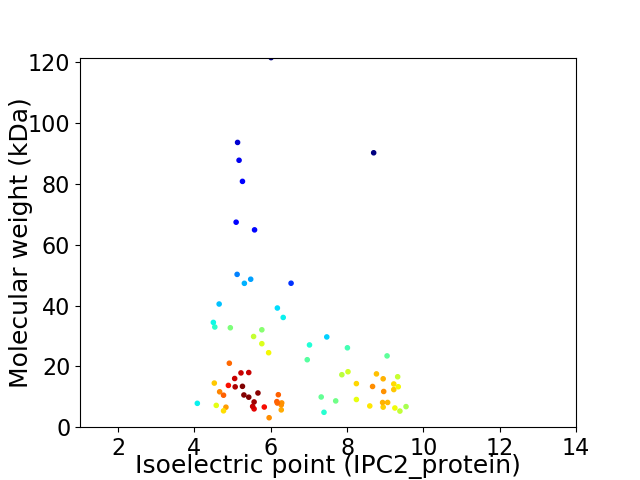
Virtual 2D-PAGE plot for 76 proteins (isoelectric point calculated using IPC2_protein)
Get csv file with sequences according to given criteria:
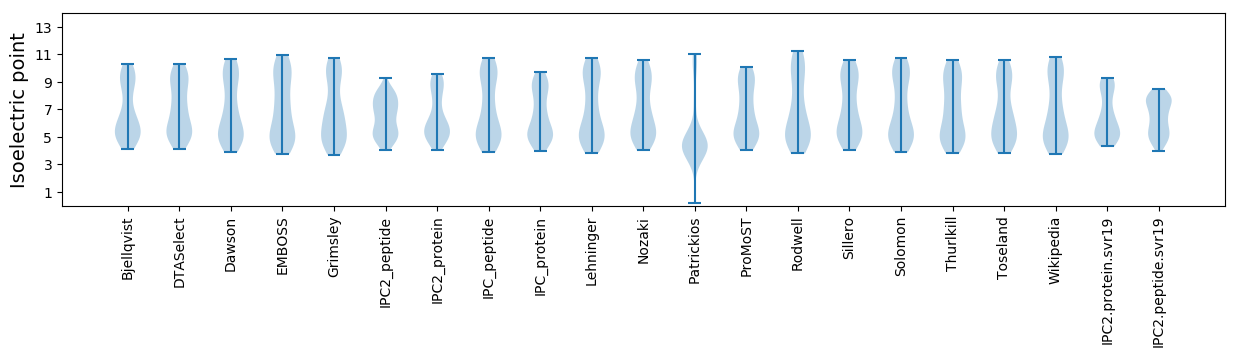
* You can choose from 21 different methods for calculating isoelectric point
Summary statistics related to proteome-wise predictions
Protein with the lowest isoelectric point:
>tr|A0A2P1JUR5|A0A2P1JUR5_9CAUD Uncharacterized protein OS=Bacillus phage Anath OX=2108114 PE=4 SV=1
MM1 pKa = 7.63KK2 pKa = 10.55KK3 pKa = 10.31LLLVGALALGVVGLVGCEE21 pKa = 3.55EE22 pKa = 3.58NSYY25 pKa = 10.81YY26 pKa = 10.65FEE28 pKa = 5.07GKK30 pKa = 8.88LQKK33 pKa = 10.11EE34 pKa = 4.25SRR36 pKa = 11.84IQEE39 pKa = 4.18IIEE42 pKa = 4.49DD43 pKa = 3.9RR44 pKa = 11.84LEE46 pKa = 4.27SQLGEE51 pKa = 4.22EE52 pKa = 4.65NDD54 pKa = 3.58MEE56 pKa = 5.86IDD58 pKa = 3.21VDD60 pKa = 4.21VNIMEE65 pKa = 4.4EE66 pKa = 4.24AGDD69 pKa = 3.75EE70 pKa = 4.16
MM1 pKa = 7.63KK2 pKa = 10.55KK3 pKa = 10.31LLLVGALALGVVGLVGCEE21 pKa = 3.55EE22 pKa = 3.58NSYY25 pKa = 10.81YY26 pKa = 10.65FEE28 pKa = 5.07GKK30 pKa = 8.88LQKK33 pKa = 10.11EE34 pKa = 4.25SRR36 pKa = 11.84IQEE39 pKa = 4.18IIEE42 pKa = 4.49DD43 pKa = 3.9RR44 pKa = 11.84LEE46 pKa = 4.27SQLGEE51 pKa = 4.22EE52 pKa = 4.65NDD54 pKa = 3.58MEE56 pKa = 5.86IDD58 pKa = 3.21VDD60 pKa = 4.21VNIMEE65 pKa = 4.4EE66 pKa = 4.24AGDD69 pKa = 3.75EE70 pKa = 4.16
Molecular weight: 7.85 kDa
Isoelectric point according different methods:
Protein with the highest isoelectric point:
>tr|A0A2P1JUP5|A0A2P1JUP5_9CAUD Uncharacterized protein OS=Bacillus phage Anath OX=2108114 PE=4 SV=1
MM1 pKa = 7.74TYY3 pKa = 10.7FLINAIVIGLIGATAFATWKK23 pKa = 10.37LLLKK27 pKa = 10.71FGFRR31 pKa = 11.84CQRR34 pKa = 11.84DD35 pKa = 3.44KK36 pKa = 11.57KK37 pKa = 10.67FADD40 pKa = 3.26KK41 pKa = 10.28MRR43 pKa = 11.84LVLIFVLLACVVRR56 pKa = 11.84SLMM59 pKa = 4.54
MM1 pKa = 7.74TYY3 pKa = 10.7FLINAIVIGLIGATAFATWKK23 pKa = 10.37LLLKK27 pKa = 10.71FGFRR31 pKa = 11.84CQRR34 pKa = 11.84DD35 pKa = 3.44KK36 pKa = 11.57KK37 pKa = 10.67FADD40 pKa = 3.26KK41 pKa = 10.28MRR43 pKa = 11.84LVLIFVLLACVVRR56 pKa = 11.84SLMM59 pKa = 4.54
Molecular weight: 6.77 kDa
Isoelectric point according different methods:
Peptides (in silico digests for buttom-up proteomics)
Below you can find in silico digests of the whole proteome with Trypsin, Chymotrypsin, Trypsin+LysC, LysN, ArgC proteases suitable for different mass spec machines.| Try ESI |
 |
|---|
| ChTry ESI |
|
|---|
| ArgC ESI |
|
|---|
| LysN ESI |
|
|---|
| TryLysC ESI |
|
|---|
| Try MALDI |
|
|---|
| ChTry MALDI |
|
|---|
| ArgC MALDI |
|
|---|
| LysN MALDI |
|
|---|
| TryLysC MALDI |
|
|---|
| Try LTQ |
|
|---|
| ChTry LTQ |
|
|---|
| ArgC LTQ |
|
|---|
| LysN LTQ |
|
|---|
| TryLysC LTQ |
|
|---|
| Try MSlow |
|
|---|
| ChTry MSlow |
|
|---|
| ArgC MSlow |
|
|---|
| LysN MSlow |
|
|---|
| TryLysC MSlow |
|
|---|
| Try MShigh |
|
|---|
| ChTry MShigh |
|
|---|
| ArgC MShigh |
|
|---|
| LysN MShigh |
|
|---|
| TryLysC MShigh |
|
|---|
General Statistics
Number of major isoforms |
Number of additional isoforms |
Number of all proteins |
Number of amino acids |
Min. Seq. Length |
Max. Seq. Length |
Avg. Seq. Length |
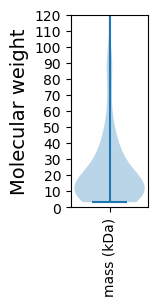
Avg. Mol. Weight |
|---|---|---|---|---|---|---|---|
0 |
15790 |
29 |
1062 |
207.8 |
23.56 |
Amino acid frequency
Ala |
Cys |
Asp |
Glu |
Phe |
Gly |
His |
Ile |
Lys |
Leu |
|---|---|---|---|---|---|---|---|---|---|
7.036 ± 0.356 | 0.918 ± 0.121 |
5.909 ± 0.223 | 7.612 ± 0.413 |
4.414 ± 0.167 | 6.732 ± 0.223 |
1.963 ± 0.169 | 6.137 ± 0.16 |
7.821 ± 0.39 | 8.075 ± 0.278 |
Met |
Asn |
Gln |
Pro |
Arg |
Ser |
Thr |
Val |
Trp |
Tyr |
|---|---|---|---|---|---|---|---|---|---|
3.053 ± 0.173 | 5.054 ± 0.288 |
2.869 ± 0.204 | 3.901 ± 0.142 |
4.56 ± 0.249 | 5.51 ± 0.385 |
5.997 ± 0.328 | 7.099 ± 0.275 |
1.393 ± 0.148 | 3.946 ± 0.209 |
Most of the basic statistics you can see at this page can be downloaded from this CSV file
See this proteome in:

Proteome-pI is available under Creative Commons Attribution-NoDerivs license, for more details see here
| Reference: Kozlowski LP. Proteome-pI 2.0: Proteome Isoelectric Point Database Update. Nucleic Acids Res. 2021, doi: 10.1093/nar/gkab944 | Contact: Lukasz P. Kozlowski |