Shewanella sp. phage 3/49
Taxonomy: Viruses; Duplodnaviria; Heunggongvirae; Uroviricota; Caudoviricetes; Caudovirales; Siphoviridae; unclassified Siphoviridae
Average proteome isoelectric point is 6.16
Get precalculated fractions of proteins
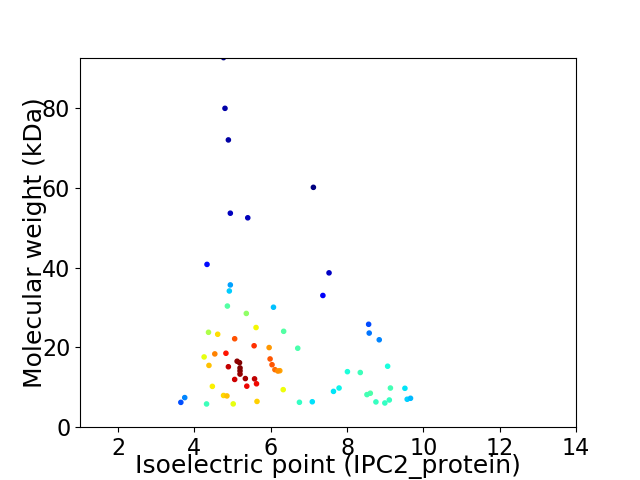
Virtual 2D-PAGE plot for 70 proteins (isoelectric point calculated using IPC2_protein)
Get csv file with sequences according to given criteria:
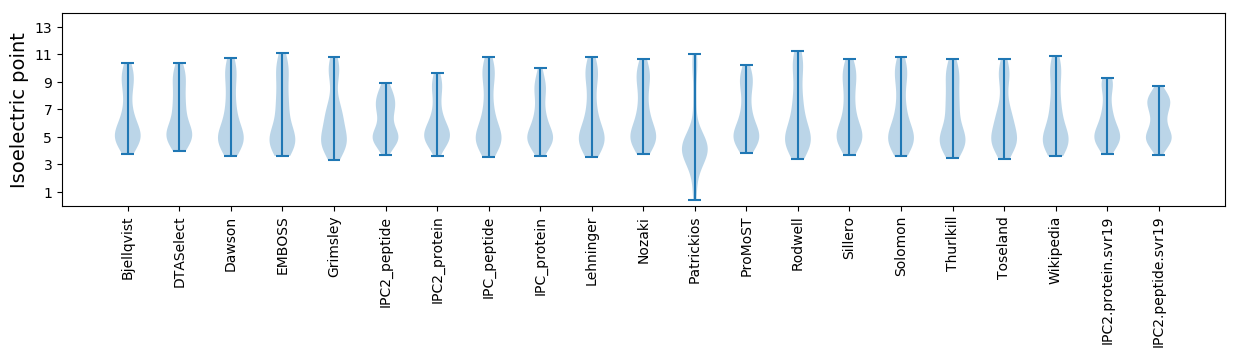
* You can choose from 21 different methods for calculating isoelectric point
Summary statistics related to proteome-wise predictions
Protein with the lowest isoelectric point:
>tr|A0A088C4F7|A0A088C4F7_9CAUD Uncharacterized protein OS=Shewanella sp. phage 3/49 OX=1458863 GN=S349_56 PE=4 SV=1
MM1 pKa = 7.61TIDD4 pKa = 4.17IDD6 pKa = 4.14YY7 pKa = 11.04QDD9 pKa = 3.92VEE11 pKa = 5.18AIAAMRR17 pKa = 11.84YY18 pKa = 9.88GSLDD22 pKa = 3.34DD23 pKa = 5.33AAFADD28 pKa = 3.5AWLVMSHH35 pKa = 6.9NIYY38 pKa = 11.08ASMIIAADD46 pKa = 3.73VVDD49 pKa = 5.12DD50 pKa = 3.94FLNRR54 pKa = 11.84TVV56 pKa = 3.3
MM1 pKa = 7.61TIDD4 pKa = 4.17IDD6 pKa = 4.14YY7 pKa = 11.04QDD9 pKa = 3.92VEE11 pKa = 5.18AIAAMRR17 pKa = 11.84YY18 pKa = 9.88GSLDD22 pKa = 3.34DD23 pKa = 5.33AAFADD28 pKa = 3.5AWLVMSHH35 pKa = 6.9NIYY38 pKa = 11.08ASMIIAADD46 pKa = 3.73VVDD49 pKa = 5.12DD50 pKa = 3.94FLNRR54 pKa = 11.84TVV56 pKa = 3.3
Molecular weight: 6.23 kDa
Isoelectric point according different methods:
Protein with the highest isoelectric point:
>tr|A0A088C543|A0A088C543_9CAUD Uncharacterized protein OS=Shewanella sp. phage 3/49 OX=1458863 GN=S349_17 PE=4 SV=1
MM1 pKa = 7.21YY2 pKa = 10.29CNNQAKK8 pKa = 9.47KK9 pKa = 9.95QAAFYY14 pKa = 10.77HH15 pKa = 5.34NQQLDD20 pKa = 3.52YY21 pKa = 11.39DD22 pKa = 4.07RR23 pKa = 11.84WLMDD27 pKa = 2.99NTRR30 pKa = 11.84NQQRR34 pKa = 11.84QRR36 pKa = 11.84WIAPAKK42 pKa = 8.24TRR44 pKa = 11.84KK45 pKa = 9.73ALATILAMSAGFAQIYY61 pKa = 9.27
MM1 pKa = 7.21YY2 pKa = 10.29CNNQAKK8 pKa = 9.47KK9 pKa = 9.95QAAFYY14 pKa = 10.77HH15 pKa = 5.34NQQLDD20 pKa = 3.52YY21 pKa = 11.39DD22 pKa = 4.07RR23 pKa = 11.84WLMDD27 pKa = 2.99NTRR30 pKa = 11.84NQQRR34 pKa = 11.84QRR36 pKa = 11.84WIAPAKK42 pKa = 8.24TRR44 pKa = 11.84KK45 pKa = 9.73ALATILAMSAGFAQIYY61 pKa = 9.27
Molecular weight: 7.25 kDa
Isoelectric point according different methods:
Peptides (in silico digests for buttom-up proteomics)
Below you can find in silico digests of the whole proteome with Trypsin, Chymotrypsin, Trypsin+LysC, LysN, ArgC proteases suitable for different mass spec machines.| Try ESI |
 |
|---|
| ChTry ESI |
|
|---|
| ArgC ESI |
|
|---|
| LysN ESI |
|
|---|
| TryLysC ESI |
|
|---|
| Try MALDI |
|
|---|
| ChTry MALDI |
|
|---|
| ArgC MALDI |
|
|---|
| LysN MALDI |
|
|---|
| TryLysC MALDI |
|
|---|
| Try LTQ |
|
|---|
| ChTry LTQ |
|
|---|
| ArgC LTQ |
|
|---|
| LysN LTQ |
|
|---|
| TryLysC LTQ |
|
|---|
| Try MSlow |
|
|---|
| ChTry MSlow |
|
|---|
| ArgC MSlow |
|
|---|
| LysN MSlow |
|
|---|
| TryLysC MSlow |
|
|---|
| Try MShigh |
|
|---|
| ChTry MShigh |
|
|---|
| ArgC MShigh |
|
|---|
| LysN MShigh |
|
|---|
| TryLysC MShigh |
|
|---|
General Statistics
Number of major isoforms |
Number of additional isoforms |
Number of all proteins |
Number of amino acids |
Min. Seq. Length |
Max. Seq. Length |
Avg. Seq. Length |
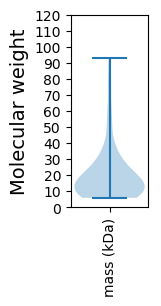
Avg. Mol. Weight |
|---|---|---|---|---|---|---|---|
0 |
12964 |
47 |
848 |
185.2 |
20.53 |
Amino acid frequency
Ala |
Cys |
Asp |
Glu |
Phe |
Gly |
His |
Ile |
Lys |
Leu |
|---|---|---|---|---|---|---|---|---|---|
9.002 ± 0.549 | 1.496 ± 0.174 |
6.464 ± 0.209 | 6.109 ± 0.281 |
3.973 ± 0.179 | 6.757 ± 0.407 |
1.635 ± 0.173 | 6.503 ± 0.23 |
6.773 ± 0.428 | 7.505 ± 0.306 |
Met |
Asn |
Gln |
Pro |
Arg |
Ser |
Thr |
Val |
Trp |
Tyr |
|---|---|---|---|---|---|---|---|---|---|
2.8 ± 0.177 | 5.546 ± 0.225 |
3.132 ± 0.193 | 3.664 ± 0.212 |
4.196 ± 0.198 | 7.266 ± 0.34 |
5.978 ± 0.257 | 6.549 ± 0.288 |
1.257 ± 0.138 | 3.394 ± 0.243 |
Most of the basic statistics you can see at this page can be downloaded from this CSV file
See this proteome in:

Proteome-pI is available under Creative Commons Attribution-NoDerivs license, for more details see here
| Reference: Kozlowski LP. Proteome-pI 2.0: Proteome Isoelectric Point Database Update. Nucleic Acids Res. 2021, doi: 10.1093/nar/gkab944 | Contact: Lukasz P. Kozlowski |