Paenalcaligenes hominis
Taxonomy: cellular organisms; Bacteria; Proteobacteria; Betaproteobacteria; Burkholderiales; Alcaligenaceae; Paenalcaligenes
Average proteome isoelectric point is 6.37
Get precalculated fractions of proteins
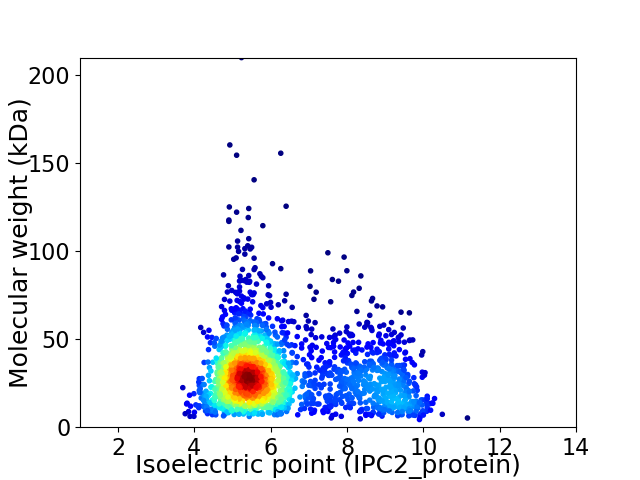
Virtual 2D-PAGE plot for 2082 proteins (isoelectric point calculated using IPC2_protein)
Get csv file with sequences according to given criteria:
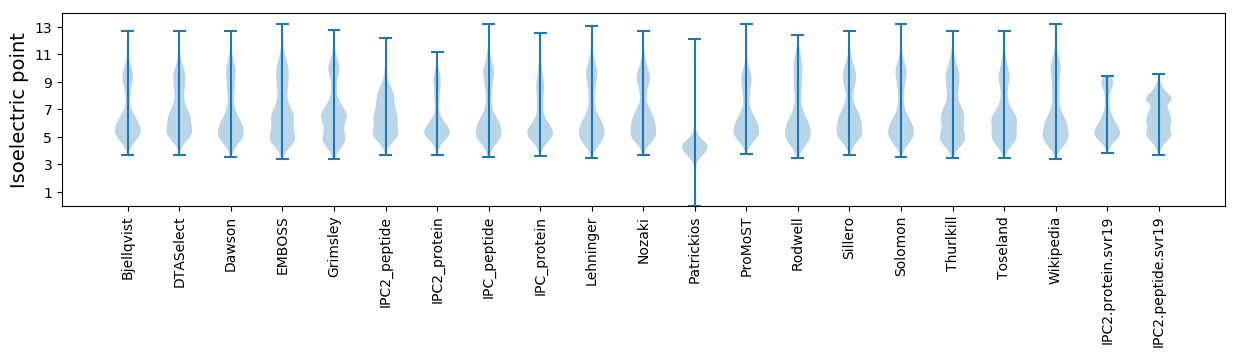
* You can choose from 21 different methods for calculating isoelectric point
Summary statistics related to proteome-wise predictions
Protein with the lowest isoelectric point:
>tr|A0A1U9JZY0|A0A1U9JZY0_9BURK Uncharacterized protein OS=Paenalcaligenes hominis OX=643674 GN=PAEH1_06790 PE=4 SV=1
MM1 pKa = 6.77STWMCLICGWIYY13 pKa = 11.01DD14 pKa = 4.19EE15 pKa = 4.49EE16 pKa = 6.25AGLPEE21 pKa = 4.49EE22 pKa = 5.51GIAPGTKK29 pKa = 9.07WEE31 pKa = 4.43DD32 pKa = 3.47VPPNWVCPEE41 pKa = 3.8CGARR45 pKa = 11.84KK46 pKa = 9.53EE47 pKa = 4.01DD48 pKa = 3.72FEE50 pKa = 4.59MIEE53 pKa = 4.03VV54 pKa = 3.56
MM1 pKa = 6.77STWMCLICGWIYY13 pKa = 11.01DD14 pKa = 4.19EE15 pKa = 4.49EE16 pKa = 6.25AGLPEE21 pKa = 4.49EE22 pKa = 5.51GIAPGTKK29 pKa = 9.07WEE31 pKa = 4.43DD32 pKa = 3.47VPPNWVCPEE41 pKa = 3.8CGARR45 pKa = 11.84KK46 pKa = 9.53EE47 pKa = 4.01DD48 pKa = 3.72FEE50 pKa = 4.59MIEE53 pKa = 4.03VV54 pKa = 3.56
Molecular weight: 6.16 kDa
Isoelectric point according different methods:
Protein with the highest isoelectric point:
>tr|A0A1U9K0K4|A0A1U9K0K4_9BURK DNA polymerase IV OS=Paenalcaligenes hominis OX=643674 GN=dinB PE=3 SV=1
MM1 pKa = 7.35KK2 pKa = 9.36RR3 pKa = 11.84TYY5 pKa = 10.06QPSVTRR11 pKa = 11.84RR12 pKa = 11.84KK13 pKa = 8.26RR14 pKa = 11.84THH16 pKa = 5.86GFRR19 pKa = 11.84LRR21 pKa = 11.84MKK23 pKa = 9.28TRR25 pKa = 11.84GGRR28 pKa = 11.84AVLNARR34 pKa = 11.84RR35 pKa = 11.84AKK37 pKa = 9.65GRR39 pKa = 11.84KK40 pKa = 8.75RR41 pKa = 11.84LAVV44 pKa = 3.41
MM1 pKa = 7.35KK2 pKa = 9.36RR3 pKa = 11.84TYY5 pKa = 10.06QPSVTRR11 pKa = 11.84RR12 pKa = 11.84KK13 pKa = 8.26RR14 pKa = 11.84THH16 pKa = 5.86GFRR19 pKa = 11.84LRR21 pKa = 11.84MKK23 pKa = 9.28TRR25 pKa = 11.84GGRR28 pKa = 11.84AVLNARR34 pKa = 11.84RR35 pKa = 11.84AKK37 pKa = 9.65GRR39 pKa = 11.84KK40 pKa = 8.75RR41 pKa = 11.84LAVV44 pKa = 3.41
Molecular weight: 5.22 kDa
Isoelectric point according different methods:
Peptides (in silico digests for buttom-up proteomics)
Below you can find in silico digests of the whole proteome with Trypsin, Chymotrypsin, Trypsin+LysC, LysN, ArgC proteases suitable for different mass spec machines.| Try ESI |
 |
|---|
| ChTry ESI |
|
|---|
| ArgC ESI |
|
|---|
| LysN ESI |
|
|---|
| TryLysC ESI |
|
|---|
| Try MALDI |
|
|---|
| ChTry MALDI |
|
|---|
| ArgC MALDI |
|
|---|
| LysN MALDI |
|
|---|
| TryLysC MALDI |
|
|---|
| Try LTQ |
|
|---|
| ChTry LTQ |
|
|---|
| ArgC LTQ |
|
|---|
| LysN LTQ |
|
|---|
| TryLysC LTQ |
|
|---|
| Try MSlow |
|
|---|
| ChTry MSlow |
|
|---|
| ArgC MSlow |
|
|---|
| LysN MSlow |
|
|---|
| TryLysC MSlow |
|
|---|
| Try MShigh |
|
|---|
| ChTry MShigh |
|
|---|
| ArgC MShigh |
|
|---|
| LysN MShigh |
|
|---|
| TryLysC MShigh |
|
|---|
General Statistics
Number of major isoforms |
Number of additional isoforms |
Number of all proteins |
Number of amino acids |
Min. Seq. Length |
Max. Seq. Length |
Avg. Seq. Length |
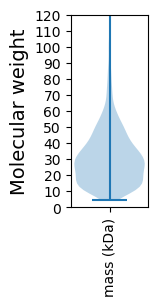
Avg. Mol. Weight |
|---|---|---|---|---|---|---|---|
0 |
604123 |
37 |
1957 |
290.2 |
32.04 |
Amino acid frequency
Ala |
Cys |
Asp |
Glu |
Phe |
Gly |
His |
Ile |
Lys |
Leu |
|---|---|---|---|---|---|---|---|---|---|
10.475 ± 0.06 | 0.901 ± 0.018 |
5.092 ± 0.042 | 5.599 ± 0.056 |
3.741 ± 0.034 | 6.935 ± 0.05 |
2.665 ± 0.033 | 5.613 ± 0.042 |
3.831 ± 0.042 | 10.988 ± 0.07 |
Met |
Asn |
Gln |
Pro |
Arg |
Ser |
Thr |
Val |
Trp |
Tyr |
|---|---|---|---|---|---|---|---|---|---|
2.453 ± 0.025 | 3.338 ± 0.033 |
4.623 ± 0.034 | 5.332 ± 0.048 |
5.467 ± 0.041 | 5.892 ± 0.043 |
5.53 ± 0.034 | 7.288 ± 0.045 |
1.451 ± 0.028 | 2.786 ± 0.031 |
Most of the basic statistics you can see at this page can be downloaded from this CSV file
See this proteome in:

Proteome-pI is available under Creative Commons Attribution-NoDerivs license, for more details see here
| Reference: Kozlowski LP. Proteome-pI 2.0: Proteome Isoelectric Point Database Update. Nucleic Acids Res. 2021, doi: 10.1093/nar/gkab944 | Contact: Lukasz P. Kozlowski |