Brumimicrobium sp. C305
Taxonomy: cellular organisms; Bacteria; FCB group; Bacteroidetes/Chlorobi group; Bacteroidetes; Flavobacteriia; Flavobacteriales; Crocinitomicaceae; Brumimicrobium; unclassified Brumimicrobium
Average proteome isoelectric point is 6.31
Get precalculated fractions of proteins
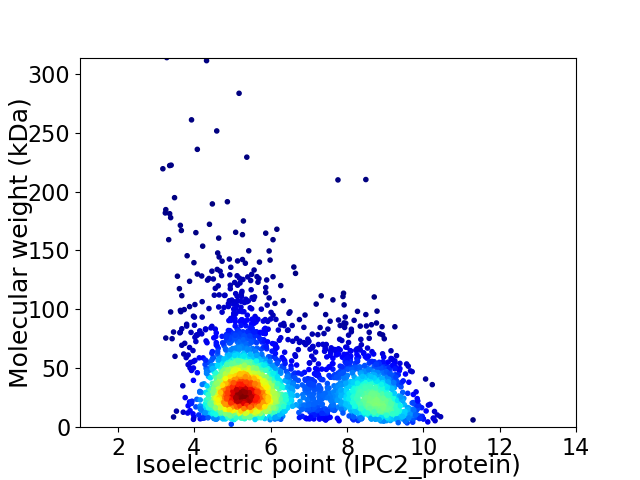
Virtual 2D-PAGE plot for 3111 proteins (isoelectric point calculated using IPC2_protein)
Get csv file with sequences according to given criteria:
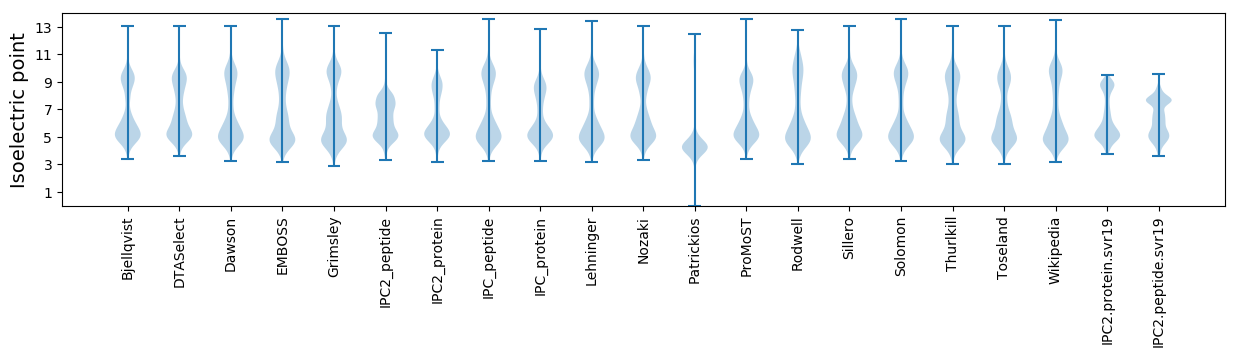
* You can choose from 21 different methods for calculating isoelectric point
Summary statistics related to proteome-wise predictions
Protein with the lowest isoelectric point:
>tr|A0A2U2XAX5|A0A2U2XAX5_9FLAO QacE family quaternary ammonium compound efflux SMR transporter OS=Brumimicrobium sp. C305 OX=2100725 GN=DIT68_12170 PE=3 SV=1
MM1 pKa = 7.14KK2 pKa = 10.05TFLRR6 pKa = 11.84SVAVFIAASFTMNASAQIPDD26 pKa = 3.49NGIWPAGVTFTDD38 pKa = 3.78INGTTHH44 pKa = 7.54DD45 pKa = 4.38MDD47 pKa = 5.27ALLDD51 pKa = 4.02AGKK54 pKa = 8.13TVIIDD59 pKa = 5.17AFADD63 pKa = 3.26WCAPCWNYY71 pKa = 10.28HH72 pKa = 5.4QGHH75 pKa = 6.61ALEE78 pKa = 4.71NLYY81 pKa = 8.52TQYY84 pKa = 11.32GPNGTDD90 pKa = 2.78EE91 pKa = 5.02LMVLGIEE98 pKa = 4.42ADD100 pKa = 3.5PGEE103 pKa = 4.55AEE105 pKa = 5.13SNISDD110 pKa = 4.51PNTGMGDD117 pKa = 3.17WTVGISYY124 pKa = 8.93PQANDD129 pKa = 3.42DD130 pKa = 4.83AIAGIINLAYY140 pKa = 9.08YY141 pKa = 6.72PTVIMVCPDD150 pKa = 3.23RR151 pKa = 11.84SVTEE155 pKa = 4.05VGQEE159 pKa = 3.93STANLYY165 pKa = 10.81AGISTCGAPASNSNDD180 pKa = 2.73PRR182 pKa = 11.84LIANASDD189 pKa = 3.68NLFCAGSSANMSVVLQNFSTAPLTSATIEE218 pKa = 4.19VMDD221 pKa = 4.66GATSVATEE229 pKa = 3.64NWTGNLAPYY238 pKa = 10.38DD239 pKa = 3.82VTTIALGSVSPSGSTNYY256 pKa = 9.13TIKK259 pKa = 9.49ITSANDD265 pKa = 3.17DD266 pKa = 3.75TSNDD270 pKa = 3.41QITASVAPAPVLRR283 pKa = 11.84VGDD286 pKa = 3.39QTKK289 pKa = 10.54AVNVVLAGDD298 pKa = 4.15AYY300 pKa = 10.07KK301 pKa = 10.9DD302 pKa = 3.27EE303 pKa = 4.38TGIIFDD309 pKa = 4.67EE310 pKa = 5.29GPLPNEE316 pKa = 4.19SFVTIHH322 pKa = 6.6NDD324 pKa = 2.85AAGGITTPLGFAQVGTLPQGAAPLTVTYY352 pKa = 10.75NAVNEE357 pKa = 4.35GCHH360 pKa = 5.09YY361 pKa = 10.84VVIVDD366 pKa = 4.5SYY368 pKa = 11.85GDD370 pKa = 3.92GINYY374 pKa = 8.47QMPTAEE380 pKa = 5.65LRR382 pKa = 11.84IQGDD386 pKa = 4.08GTSKK390 pKa = 10.44IDD392 pKa = 3.4VNPDD396 pKa = 3.06FGDD399 pKa = 4.79GIAVLFDD406 pKa = 3.27VQFQTEE412 pKa = 4.31VSVNTEE418 pKa = 3.76EE419 pKa = 4.32FASSFKK425 pKa = 10.92VFPNPTNSVVNVEE438 pKa = 5.28FEE440 pKa = 4.31LQNQEE445 pKa = 4.24DD446 pKa = 4.52VTVSIMNTVGQTVAVNNLGTVSGVQATQMDD476 pKa = 4.4VSSLEE481 pKa = 3.79SGMYY485 pKa = 8.54IVKK488 pKa = 10.33VKK490 pKa = 9.12TANGEE495 pKa = 3.85QTKK498 pKa = 10.23RR499 pKa = 11.84ISVIKK504 pKa = 10.54
MM1 pKa = 7.14KK2 pKa = 10.05TFLRR6 pKa = 11.84SVAVFIAASFTMNASAQIPDD26 pKa = 3.49NGIWPAGVTFTDD38 pKa = 3.78INGTTHH44 pKa = 7.54DD45 pKa = 4.38MDD47 pKa = 5.27ALLDD51 pKa = 4.02AGKK54 pKa = 8.13TVIIDD59 pKa = 5.17AFADD63 pKa = 3.26WCAPCWNYY71 pKa = 10.28HH72 pKa = 5.4QGHH75 pKa = 6.61ALEE78 pKa = 4.71NLYY81 pKa = 8.52TQYY84 pKa = 11.32GPNGTDD90 pKa = 2.78EE91 pKa = 5.02LMVLGIEE98 pKa = 4.42ADD100 pKa = 3.5PGEE103 pKa = 4.55AEE105 pKa = 5.13SNISDD110 pKa = 4.51PNTGMGDD117 pKa = 3.17WTVGISYY124 pKa = 8.93PQANDD129 pKa = 3.42DD130 pKa = 4.83AIAGIINLAYY140 pKa = 9.08YY141 pKa = 6.72PTVIMVCPDD150 pKa = 3.23RR151 pKa = 11.84SVTEE155 pKa = 4.05VGQEE159 pKa = 3.93STANLYY165 pKa = 10.81AGISTCGAPASNSNDD180 pKa = 2.73PRR182 pKa = 11.84LIANASDD189 pKa = 3.68NLFCAGSSANMSVVLQNFSTAPLTSATIEE218 pKa = 4.19VMDD221 pKa = 4.66GATSVATEE229 pKa = 3.64NWTGNLAPYY238 pKa = 10.38DD239 pKa = 3.82VTTIALGSVSPSGSTNYY256 pKa = 9.13TIKK259 pKa = 9.49ITSANDD265 pKa = 3.17DD266 pKa = 3.75TSNDD270 pKa = 3.41QITASVAPAPVLRR283 pKa = 11.84VGDD286 pKa = 3.39QTKK289 pKa = 10.54AVNVVLAGDD298 pKa = 4.15AYY300 pKa = 10.07KK301 pKa = 10.9DD302 pKa = 3.27EE303 pKa = 4.38TGIIFDD309 pKa = 4.67EE310 pKa = 5.29GPLPNEE316 pKa = 4.19SFVTIHH322 pKa = 6.6NDD324 pKa = 2.85AAGGITTPLGFAQVGTLPQGAAPLTVTYY352 pKa = 10.75NAVNEE357 pKa = 4.35GCHH360 pKa = 5.09YY361 pKa = 10.84VVIVDD366 pKa = 4.5SYY368 pKa = 11.85GDD370 pKa = 3.92GINYY374 pKa = 8.47QMPTAEE380 pKa = 5.65LRR382 pKa = 11.84IQGDD386 pKa = 4.08GTSKK390 pKa = 10.44IDD392 pKa = 3.4VNPDD396 pKa = 3.06FGDD399 pKa = 4.79GIAVLFDD406 pKa = 3.27VQFQTEE412 pKa = 4.31VSVNTEE418 pKa = 3.76EE419 pKa = 4.32FASSFKK425 pKa = 10.92VFPNPTNSVVNVEE438 pKa = 5.28FEE440 pKa = 4.31LQNQEE445 pKa = 4.24DD446 pKa = 4.52VTVSIMNTVGQTVAVNNLGTVSGVQATQMDD476 pKa = 4.4VSSLEE481 pKa = 3.79SGMYY485 pKa = 8.54IVKK488 pKa = 10.33VKK490 pKa = 9.12TANGEE495 pKa = 3.85QTKK498 pKa = 10.23RR499 pKa = 11.84ISVIKK504 pKa = 10.54
Molecular weight: 53.04 kDa
Isoelectric point according different methods:
Protein with the highest isoelectric point:
>tr|A0A2U2XGK8|A0A2U2XGK8_9FLAO Phosphohistidine phosphatase SixA OS=Brumimicrobium sp. C305 OX=2100725 GN=DIT68_00845 PE=4 SV=1
MM1 pKa = 7.45KK2 pKa = 9.54RR3 pKa = 11.84TFQPSQRR10 pKa = 11.84KK11 pKa = 8.72RR12 pKa = 11.84RR13 pKa = 11.84NKK15 pKa = 9.56HH16 pKa = 3.99GFRR19 pKa = 11.84SRR21 pKa = 11.84MATKK25 pKa = 10.11NGRR28 pKa = 11.84RR29 pKa = 11.84VLAARR34 pKa = 11.84RR35 pKa = 11.84KK36 pKa = 9.46KK37 pKa = 10.2GRR39 pKa = 11.84KK40 pKa = 8.95SLTVSSNKK48 pKa = 9.3LAKK51 pKa = 10.16RR52 pKa = 3.58
MM1 pKa = 7.45KK2 pKa = 9.54RR3 pKa = 11.84TFQPSQRR10 pKa = 11.84KK11 pKa = 8.72RR12 pKa = 11.84RR13 pKa = 11.84NKK15 pKa = 9.56HH16 pKa = 3.99GFRR19 pKa = 11.84SRR21 pKa = 11.84MATKK25 pKa = 10.11NGRR28 pKa = 11.84RR29 pKa = 11.84VLAARR34 pKa = 11.84RR35 pKa = 11.84KK36 pKa = 9.46KK37 pKa = 10.2GRR39 pKa = 11.84KK40 pKa = 8.95SLTVSSNKK48 pKa = 9.3LAKK51 pKa = 10.16RR52 pKa = 3.58
Molecular weight: 6.17 kDa
Isoelectric point according different methods:
Peptides (in silico digests for buttom-up proteomics)
Below you can find in silico digests of the whole proteome with Trypsin, Chymotrypsin, Trypsin+LysC, LysN, ArgC proteases suitable for different mass spec machines.| Try ESI |
 |
|---|
| ChTry ESI |
|
|---|
| ArgC ESI |
|
|---|
| LysN ESI |
|
|---|
| TryLysC ESI |
|
|---|
| Try MALDI |
|
|---|
| ChTry MALDI |
|
|---|
| ArgC MALDI |
|
|---|
| LysN MALDI |
|
|---|
| TryLysC MALDI |
|
|---|
| Try LTQ |
|
|---|
| ChTry LTQ |
|
|---|
| ArgC LTQ |
|
|---|
| LysN LTQ |
|
|---|
| TryLysC LTQ |
|
|---|
| Try MSlow |
|
|---|
| ChTry MSlow |
|
|---|
| ArgC MSlow |
|
|---|
| LysN MSlow |
|
|---|
| TryLysC MSlow |
|
|---|
| Try MShigh |
|
|---|
| ChTry MShigh |
|
|---|
| ArgC MShigh |
|
|---|
| LysN MShigh |
|
|---|
| TryLysC MShigh |
|
|---|
General Statistics
Number of major isoforms |
Number of additional isoforms |
Number of all proteins |
Number of amino acids |
Min. Seq. Length |
Max. Seq. Length |
Avg. Seq. Length |
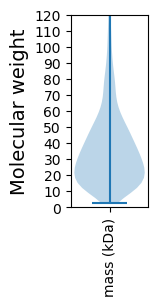
Avg. Mol. Weight |
|---|---|---|---|---|---|---|---|
0 |
1076708 |
22 |
2970 |
346.1 |
39.04 |
Amino acid frequency
Ala |
Cys |
Asp |
Glu |
Phe |
Gly |
His |
Ile |
Lys |
Leu |
|---|---|---|---|---|---|---|---|---|---|
6.113 ± 0.044 | 0.792 ± 0.02 |
5.6 ± 0.038 | 7.01 ± 0.057 |
5.277 ± 0.041 | 6.568 ± 0.051 |
1.766 ± 0.019 | 7.852 ± 0.04 |
7.429 ± 0.075 | 9.051 ± 0.049 |
Met |
Asn |
Gln |
Pro |
Arg |
Ser |
Thr |
Val |
Trp |
Tyr |
|---|---|---|---|---|---|---|---|---|---|
2.313 ± 0.024 | 6.164 ± 0.053 |
3.355 ± 0.03 | 3.374 ± 0.027 |
3.468 ± 0.035 | 6.871 ± 0.048 |
5.66 ± 0.07 | 6.261 ± 0.033 |
1.055 ± 0.016 | 4.02 ± 0.031 |
Most of the basic statistics you can see at this page can be downloaded from this CSV file
See this proteome in:

Proteome-pI is available under Creative Commons Attribution-NoDerivs license, for more details see here
| Reference: Kozlowski LP. Proteome-pI 2.0: Proteome Isoelectric Point Database Update. Nucleic Acids Res. 2021, doi: 10.1093/nar/gkab944 | Contact: Lukasz P. Kozlowski |