Bacillus phage vB_BcM_Sam112
Taxonomy: Viruses; Duplodnaviria; Heunggongvirae; Uroviricota; Caudoviricetes; Caudovirales; Myoviridae; unclassified Myoviridae
Average proteome isoelectric point is 6.68
Get precalculated fractions of proteins
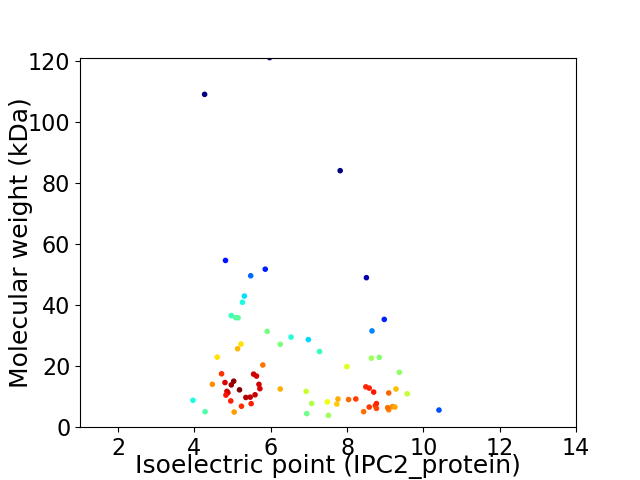
Virtual 2D-PAGE plot for 75 proteins (isoelectric point calculated using IPC2_protein)
Get csv file with sequences according to given criteria:
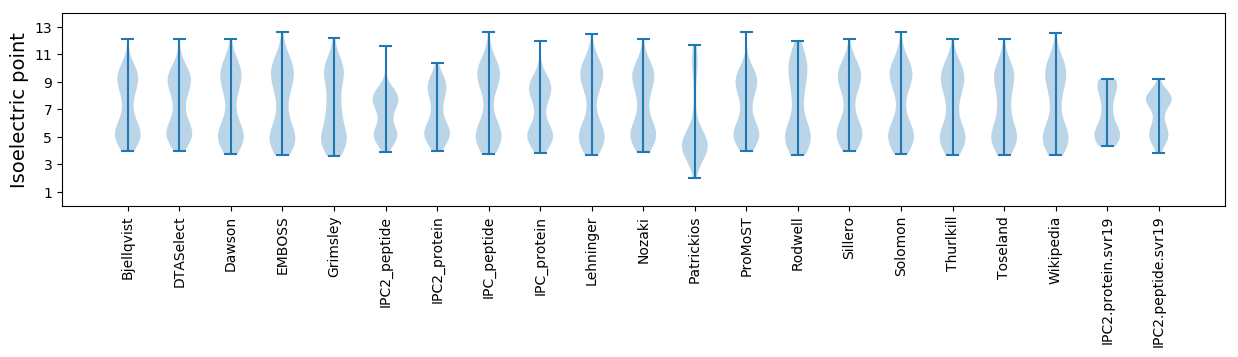
* You can choose from 21 different methods for calculating isoelectric point
Summary statistics related to proteome-wise predictions
Protein with the lowest isoelectric point:
>tr|A0A5Q2F749|A0A5Q2F749_9CAUD Portal protein OS=Bacillus phage vB_BcM_Sam112 OX=2663324 GN=Sam112_gp3 PE=4 SV=1
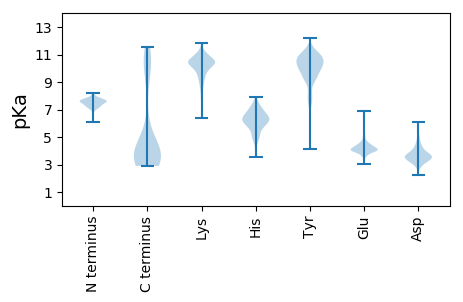
MM1 pKa = 7.76KK2 pKa = 9.08LTPEE6 pKa = 3.98QIKK9 pKa = 10.5AIQEE13 pKa = 3.86LCEE16 pKa = 4.1RR17 pKa = 11.84CDD19 pKa = 3.28WSQEE23 pKa = 3.91KK24 pKa = 10.56AVDD27 pKa = 3.63DD28 pKa = 3.82TLEE31 pKa = 3.86ILGVYY36 pKa = 9.46NQVFGEE42 pKa = 4.32AEE44 pKa = 3.75
MM1 pKa = 7.76KK2 pKa = 9.08LTPEE6 pKa = 3.98QIKK9 pKa = 10.5AIQEE13 pKa = 3.86LCEE16 pKa = 4.1RR17 pKa = 11.84CDD19 pKa = 3.28WSQEE23 pKa = 3.91KK24 pKa = 10.56AVDD27 pKa = 3.63DD28 pKa = 3.82TLEE31 pKa = 3.86ILGVYY36 pKa = 9.46NQVFGEE42 pKa = 4.32AEE44 pKa = 3.75
Molecular weight: 5.07 kDa
Isoelectric point according different methods:
Protein with the highest isoelectric point:
>tr|A0A5Q2FA70|A0A5Q2FA70_9CAUD Uncharacterized protein OS=Bacillus phage vB_BcM_Sam112 OX=2663324 GN=Sam112_gp53 PE=4 SV=1
MM1 pKa = 7.09SKK3 pKa = 10.13KK4 pKa = 9.85RR5 pKa = 11.84RR6 pKa = 11.84RR7 pKa = 11.84KK8 pKa = 9.87DD9 pKa = 2.91GFIPVVRR16 pKa = 11.84MFLSIVRR23 pKa = 11.84IIKK26 pKa = 6.47TTQKK30 pKa = 10.19RR31 pKa = 11.84RR32 pKa = 11.84RR33 pKa = 11.84NDD35 pKa = 2.9RR36 pKa = 11.84KK37 pKa = 9.41ATEE40 pKa = 3.72KK41 pKa = 9.87HH42 pKa = 6.03TINNN46 pKa = 3.63
MM1 pKa = 7.09SKK3 pKa = 10.13KK4 pKa = 9.85RR5 pKa = 11.84RR6 pKa = 11.84RR7 pKa = 11.84KK8 pKa = 9.87DD9 pKa = 2.91GFIPVVRR16 pKa = 11.84MFLSIVRR23 pKa = 11.84IIKK26 pKa = 6.47TTQKK30 pKa = 10.19RR31 pKa = 11.84RR32 pKa = 11.84RR33 pKa = 11.84NDD35 pKa = 2.9RR36 pKa = 11.84KK37 pKa = 9.41ATEE40 pKa = 3.72KK41 pKa = 9.87HH42 pKa = 6.03TINNN46 pKa = 3.63
Molecular weight: 5.62 kDa
Isoelectric point according different methods:
Peptides (in silico digests for buttom-up proteomics)
Below you can find in silico digests of the whole proteome with Trypsin, Chymotrypsin, Trypsin+LysC, LysN, ArgC proteases suitable for different mass spec machines.| Try ESI |
 |
|---|
| ChTry ESI |
|
|---|
| ArgC ESI |
|
|---|
| LysN ESI |
|
|---|
| TryLysC ESI |
|
|---|
| Try MALDI |
|
|---|
| ChTry MALDI |
|
|---|
| ArgC MALDI |
|
|---|
| LysN MALDI |
|
|---|
| TryLysC MALDI |
|
|---|
| Try LTQ |
|
|---|
| ChTry LTQ |
|
|---|
| ArgC LTQ |
|
|---|
| LysN LTQ |
|
|---|
| TryLysC LTQ |
|
|---|
| Try MSlow |
|
|---|
| ChTry MSlow |
|
|---|
| ArgC MSlow |
|
|---|
| LysN MSlow |
|
|---|
| TryLysC MSlow |
|
|---|
| Try MShigh |
|
|---|
| ChTry MShigh |
|
|---|
| ArgC MShigh |
|
|---|
| LysN MShigh |
|
|---|
| TryLysC MShigh |
|
|---|
General Statistics
Number of major isoforms |
Number of additional isoforms |
Number of all proteins |
Number of amino acids |
Min. Seq. Length |
Max. Seq. Length |
Avg. Seq. Length |
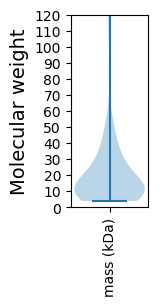
Avg. Mol. Weight |
|---|---|---|---|---|---|---|---|
0 |
14018 |
35 |
1132 |
186.9 |
20.98 |
Amino acid frequency
Ala |
Cys |
Asp |
Glu |
Phe |
Gly |
His |
Ile |
Lys |
Leu |
|---|---|---|---|---|---|---|---|---|---|
8.732 ± 0.576 | 0.592 ± 0.096 |
5.664 ± 0.238 | 7.555 ± 0.575 |
3.852 ± 0.164 | 6.891 ± 0.32 |
1.726 ± 0.163 | 6.834 ± 0.254 |
8.503 ± 0.583 | 7.212 ± 0.244 |
Met |
Asn |
Gln |
Pro |
Arg |
Ser |
Thr |
Val |
Trp |
Tyr |
|---|---|---|---|---|---|---|---|---|---|
3.025 ± 0.25 | 5.172 ± 0.344 |
3.174 ± 0.189 | 3.874 ± 0.161 |
4.166 ± 0.339 | 5.072 ± 0.3 |
6.335 ± 0.425 | 6.592 ± 0.253 |
1.434 ± 0.191 | 3.595 ± 0.292 |
Most of the basic statistics you can see at this page can be downloaded from this CSV file
See this proteome in:

Proteome-pI is available under Creative Commons Attribution-NoDerivs license, for more details see here
| Reference: Kozlowski LP. Proteome-pI 2.0: Proteome Isoelectric Point Database Update. Nucleic Acids Res. 2021, doi: 10.1093/nar/gkab944 | Contact: Lukasz P. Kozlowski |