Shewanella sp. phage 1/40
Taxonomy: Viruses; Duplodnaviria; Heunggongvirae; Uroviricota; Caudoviricetes; Caudovirales; Myoviridae; unclassified Myoviridae
Average proteome isoelectric point is 6.0
Get precalculated fractions of proteins
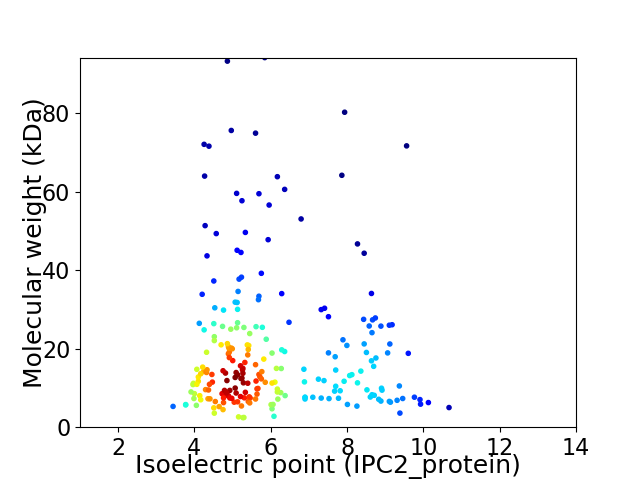
Virtual 2D-PAGE plot for 236 proteins (isoelectric point calculated using IPC2_protein)
Get csv file with sequences according to given criteria:
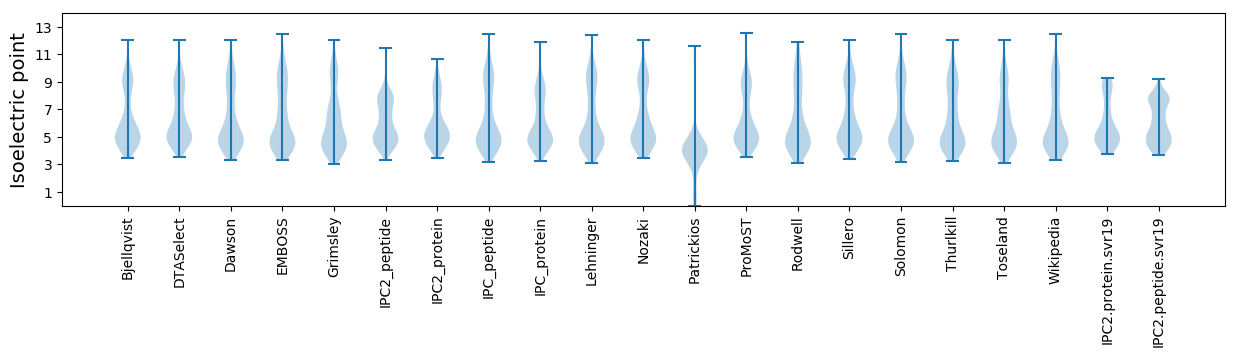
* You can choose from 21 different methods for calculating isoelectric point
Summary statistics related to proteome-wise predictions
Protein with the lowest isoelectric point:
>tr|A0A088C3M7|A0A088C3M7_9CAUD Uncharacterized protein OS=Shewanella sp. phage 1/40 OX=1458860 GN=S140_148 PE=4 SV=1
MM1 pKa = 6.98EE2 pKa = 5.24TIDD5 pKa = 3.76YY6 pKa = 9.51FEE8 pKa = 5.6CRR10 pKa = 11.84DD11 pKa = 3.91CGDD14 pKa = 3.64YY15 pKa = 11.28APDD18 pKa = 4.13GGWCDD23 pKa = 3.25RR24 pKa = 11.84CLDD27 pKa = 3.89DD28 pKa = 5.99VDD30 pKa = 3.56IEE32 pKa = 4.37EE33 pKa = 4.28YY34 pKa = 10.5EE35 pKa = 3.97EE36 pKa = 5.13RR37 pKa = 11.84KK38 pKa = 9.99RR39 pKa = 11.84EE40 pKa = 4.0WLEE43 pKa = 3.8QQEE46 pKa = 4.47DD47 pKa = 3.57
MM1 pKa = 6.98EE2 pKa = 5.24TIDD5 pKa = 3.76YY6 pKa = 9.51FEE8 pKa = 5.6CRR10 pKa = 11.84DD11 pKa = 3.91CGDD14 pKa = 3.64YY15 pKa = 11.28APDD18 pKa = 4.13GGWCDD23 pKa = 3.25RR24 pKa = 11.84CLDD27 pKa = 3.89DD28 pKa = 5.99VDD30 pKa = 3.56IEE32 pKa = 4.37EE33 pKa = 4.28YY34 pKa = 10.5EE35 pKa = 3.97EE36 pKa = 5.13RR37 pKa = 11.84KK38 pKa = 9.99RR39 pKa = 11.84EE40 pKa = 4.0WLEE43 pKa = 3.8QQEE46 pKa = 4.47DD47 pKa = 3.57
Molecular weight: 5.77 kDa
Isoelectric point according different methods:
Protein with the highest isoelectric point:
>tr|A0A088C4X3|A0A088C4X3_9CAUD Terminase large subunit OS=Shewanella sp. phage 1/40 OX=1458860 GN=S140_95 PE=4 SV=1
MM1 pKa = 7.12VRR3 pKa = 11.84SLNGKK8 pKa = 7.47QCWLAQITSVAAKK21 pKa = 10.47GFVYY25 pKa = 10.35WSRR28 pKa = 11.84LKK30 pKa = 10.78GGRR33 pKa = 11.84IQHH36 pKa = 5.98LTNNTSDD43 pKa = 3.35VSKK46 pKa = 11.05LKK48 pKa = 10.01TYY50 pKa = 11.12SKK52 pKa = 11.41
MM1 pKa = 7.12VRR3 pKa = 11.84SLNGKK8 pKa = 7.47QCWLAQITSVAAKK21 pKa = 10.47GFVYY25 pKa = 10.35WSRR28 pKa = 11.84LKK30 pKa = 10.78GGRR33 pKa = 11.84IQHH36 pKa = 5.98LTNNTSDD43 pKa = 3.35VSKK46 pKa = 11.05LKK48 pKa = 10.01TYY50 pKa = 11.12SKK52 pKa = 11.41
Molecular weight: 5.87 kDa
Isoelectric point according different methods:
Peptides (in silico digests for buttom-up proteomics)
Below you can find in silico digests of the whole proteome with Trypsin, Chymotrypsin, Trypsin+LysC, LysN, ArgC proteases suitable for different mass spec machines.| Try ESI |
 |
|---|
| ChTry ESI |
|
|---|
| ArgC ESI |
|
|---|
| LysN ESI |
|
|---|
| TryLysC ESI |
|
|---|
| Try MALDI |
|
|---|
| ChTry MALDI |
|
|---|
| ArgC MALDI |
|
|---|
| LysN MALDI |
|
|---|
| TryLysC MALDI |
|
|---|
| Try LTQ |
|
|---|
| ChTry LTQ |
|
|---|
| ArgC LTQ |
|
|---|
| LysN LTQ |
|
|---|
| TryLysC LTQ |
|
|---|
| Try MSlow |
|
|---|
| ChTry MSlow |
|
|---|
| ArgC MSlow |
|
|---|
| LysN MSlow |
|
|---|
| TryLysC MSlow |
|
|---|
| Try MShigh |
|
|---|
| ChTry MShigh |
|
|---|
| ArgC MShigh |
|
|---|
| LysN MShigh |
|
|---|
| TryLysC MShigh |
|
|---|
General Statistics
Number of major isoforms |
Number of additional isoforms |
Number of all proteins |
Number of amino acids |
Min. Seq. Length |
Max. Seq. Length |
Avg. Seq. Length |
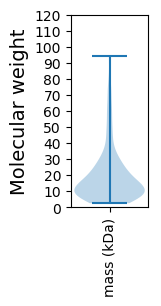
Avg. Mol. Weight |
|---|---|---|---|---|---|---|---|
0 |
41397 |
21 |
855 |
175.4 |
19.8 |
Amino acid frequency
Ala |
Cys |
Asp |
Glu |
Phe |
Gly |
His |
Ile |
Lys |
Leu |
|---|---|---|---|---|---|---|---|---|---|
5.505 ± 0.191 | 1.539 ± 0.086 |
6.517 ± 0.143 | 6.254 ± 0.19 |
4.034 ± 0.115 | 6.735 ± 0.165 |
1.964 ± 0.083 | 6.471 ± 0.131 |
7.136 ± 0.267 | 8.479 ± 0.155 |
Met |
Asn |
Gln |
Pro |
Arg |
Ser |
Thr |
Val |
Trp |
Tyr |
|---|---|---|---|---|---|---|---|---|---|
2.744 ± 0.095 | 5.781 ± 0.119 |
3.08 ± 0.124 | 3.235 ± 0.095 |
3.853 ± 0.107 | 6.824 ± 0.148 |
6.786 ± 0.201 | 7.23 ± 0.124 |
1.435 ± 0.072 | 4.399 ± 0.117 |
Most of the basic statistics you can see at this page can be downloaded from this CSV file
See this proteome in:

Proteome-pI is available under Creative Commons Attribution-NoDerivs license, for more details see here
| Reference: Kozlowski LP. Proteome-pI 2.0: Proteome Isoelectric Point Database Update. Nucleic Acids Res. 2021, doi: 10.1093/nar/gkab944 | Contact: Lukasz P. Kozlowski |