Pseudomonas phage KPP10 (Bacteriophage KPP10)
Taxonomy: Viruses; Duplodnaviria; Heunggongvirae; Uroviricota; Caudoviricetes; Caudovirales; Myoviridae; Nankokuvirus; Pseudomonas virus KPP10
Average proteome isoelectric point is 6.17
Get precalculated fractions of proteins
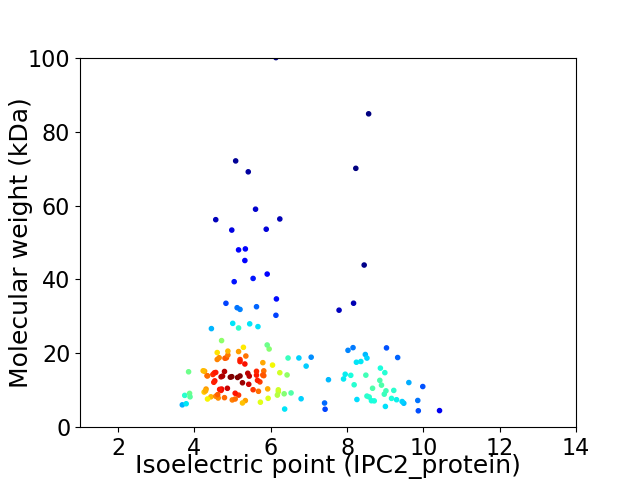
Virtual 2D-PAGE plot for 158 proteins (isoelectric point calculated using IPC2_protein)
Get csv file with sequences according to given criteria:
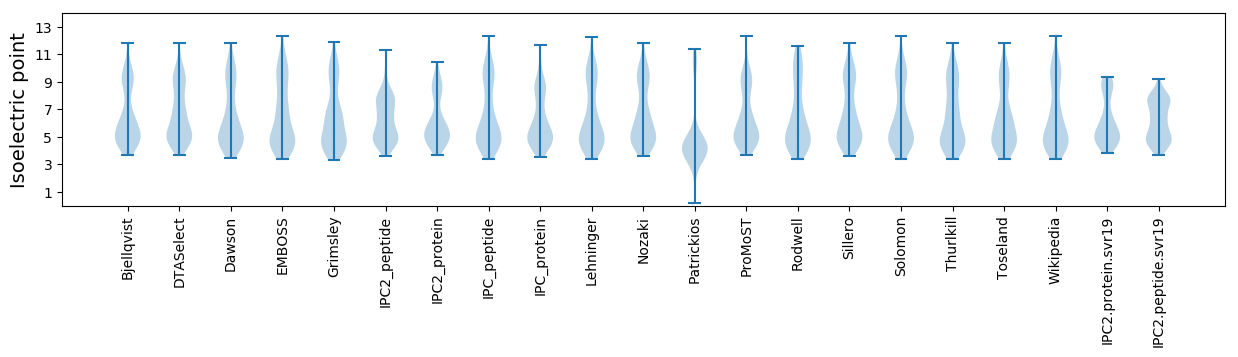
* You can choose from 21 different methods for calculating isoelectric point
Summary statistics related to proteome-wise predictions
Protein with the lowest isoelectric point:
>tr|D6RRP2|D6RRP2_BPKPP Uncharacterized protein OS=Pseudomonas phage KPP10 OX=582345 PE=4 SV=1
MM1 pKa = 7.5ISLVLTLCTALACDD15 pKa = 5.17DD16 pKa = 3.96YY17 pKa = 11.93VIAQDD22 pKa = 3.94SDD24 pKa = 3.75ADD26 pKa = 4.2IINHH30 pKa = 5.03TLYY33 pKa = 11.04VEE35 pKa = 4.31SEE37 pKa = 4.26EE38 pKa = 6.27LGDD41 pKa = 4.1AWVAPNANDD50 pKa = 4.45RR51 pKa = 11.84IGRR54 pKa = 11.84YY55 pKa = 8.0LARR58 pKa = 11.84FNISTPPAMVVDD70 pKa = 3.46YY71 pKa = 10.75DD72 pKa = 3.97YY73 pKa = 11.35TVEE76 pKa = 4.2GNN78 pKa = 3.28
MM1 pKa = 7.5ISLVLTLCTALACDD15 pKa = 5.17DD16 pKa = 3.96YY17 pKa = 11.93VIAQDD22 pKa = 3.94SDD24 pKa = 3.75ADD26 pKa = 4.2IINHH30 pKa = 5.03TLYY33 pKa = 11.04VEE35 pKa = 4.31SEE37 pKa = 4.26EE38 pKa = 6.27LGDD41 pKa = 4.1AWVAPNANDD50 pKa = 4.45RR51 pKa = 11.84IGRR54 pKa = 11.84YY55 pKa = 8.0LARR58 pKa = 11.84FNISTPPAMVVDD70 pKa = 3.46YY71 pKa = 10.75DD72 pKa = 3.97YY73 pKa = 11.35TVEE76 pKa = 4.2GNN78 pKa = 3.28
Molecular weight: 8.61 kDa
Isoelectric point according different methods:
Protein with the highest isoelectric point:
>tr|G1UCU8|G1UCU8_BPKPP Uncharacterized protein OS=Pseudomonas phage KPP10 OX=582345 PE=4 SV=1
MM1 pKa = 7.38QIHH4 pKa = 6.31FSSRR8 pKa = 11.84TAARR12 pKa = 11.84AFVKK16 pKa = 10.48GSSVPRR22 pKa = 11.84QVTDD26 pKa = 3.26NGAEE30 pKa = 3.86ASRR33 pKa = 11.84RR34 pKa = 11.84WGVKK38 pKa = 10.21LNISPSVRR46 pKa = 11.84VLGCEE51 pKa = 3.57YY52 pKa = 10.88LAFGKK57 pKa = 10.31AGNAVPVYY65 pKa = 10.56VKK67 pKa = 10.91
MM1 pKa = 7.38QIHH4 pKa = 6.31FSSRR8 pKa = 11.84TAARR12 pKa = 11.84AFVKK16 pKa = 10.48GSSVPRR22 pKa = 11.84QVTDD26 pKa = 3.26NGAEE30 pKa = 3.86ASRR33 pKa = 11.84RR34 pKa = 11.84WGVKK38 pKa = 10.21LNISPSVRR46 pKa = 11.84VLGCEE51 pKa = 3.57YY52 pKa = 10.88LAFGKK57 pKa = 10.31AGNAVPVYY65 pKa = 10.56VKK67 pKa = 10.91
Molecular weight: 7.24 kDa
Isoelectric point according different methods:
Peptides (in silico digests for buttom-up proteomics)
Below you can find in silico digests of the whole proteome with Trypsin, Chymotrypsin, Trypsin+LysC, LysN, ArgC proteases suitable for different mass spec machines.| Try ESI |
 |
|---|
| ChTry ESI |
|
|---|
| ArgC ESI |
|
|---|
| LysN ESI |
|
|---|
| TryLysC ESI |
|
|---|
| Try MALDI |
|
|---|
| ChTry MALDI |
|
|---|
| ArgC MALDI |
|
|---|
| LysN MALDI |
|
|---|
| TryLysC MALDI |
|
|---|
| Try LTQ |
|
|---|
| ChTry LTQ |
|
|---|
| ArgC LTQ |
|
|---|
| LysN LTQ |
|
|---|
| TryLysC LTQ |
|
|---|
| Try MSlow |
|
|---|
| ChTry MSlow |
|
|---|
| ArgC MSlow |
|
|---|
| LysN MSlow |
|
|---|
| TryLysC MSlow |
|
|---|
| Try MShigh |
|
|---|
| ChTry MShigh |
|
|---|
| ArgC MShigh |
|
|---|
| LysN MShigh |
|
|---|
| TryLysC MShigh |
|
|---|
General Statistics
Number of major isoforms |
Number of additional isoforms |
Number of all proteins |
Number of amino acids |
Min. Seq. Length |
Max. Seq. Length |
Avg. Seq. Length |
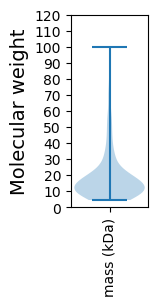
Avg. Mol. Weight |
|---|---|---|---|---|---|---|---|
0 |
26681 |
37 |
885 |
168.9 |
18.97 |
Amino acid frequency
Ala |
Cys |
Asp |
Glu |
Phe |
Gly |
His |
Ile |
Lys |
Leu |
|---|---|---|---|---|---|---|---|---|---|
8.579 ± 0.289 | 1.376 ± 0.123 |
5.948 ± 0.191 | 7.597 ± 0.249 |
3.692 ± 0.126 | 7.125 ± 0.231 |
2.118 ± 0.11 | 4.7 ± 0.132 |
5.779 ± 0.249 | 8.632 ± 0.219 |
Met |
Asn |
Gln |
Pro |
Arg |
Ser |
Thr |
Val |
Trp |
Tyr |
|---|---|---|---|---|---|---|---|---|---|
2.965 ± 0.134 | 3.962 ± 0.15 |
4.46 ± 0.203 | 3.999 ± 0.155 |
5.701 ± 0.145 | 5.573 ± 0.165 |
5.528 ± 0.204 | 7.042 ± 0.18 |
1.866 ± 0.101 | 3.358 ± 0.14 |
Most of the basic statistics you can see at this page can be downloaded from this CSV file
See this proteome in:

Proteome-pI is available under Creative Commons Attribution-NoDerivs license, for more details see here
| Reference: Kozlowski LP. Proteome-pI 2.0: Proteome Isoelectric Point Database Update. Nucleic Acids Res. 2021, doi: 10.1093/nar/gkab944 | Contact: Lukasz P. Kozlowski |