Prevotella sp. CAG:279
Taxonomy: cellular organisms; Bacteria; FCB group; Bacteroidetes/Chlorobi group; Bacteroidetes; Bacteroidia; Bacteroidales; Prevotellaceae; Prevotella; environmental samples
Average proteome isoelectric point is 6.41
Get precalculated fractions of proteins
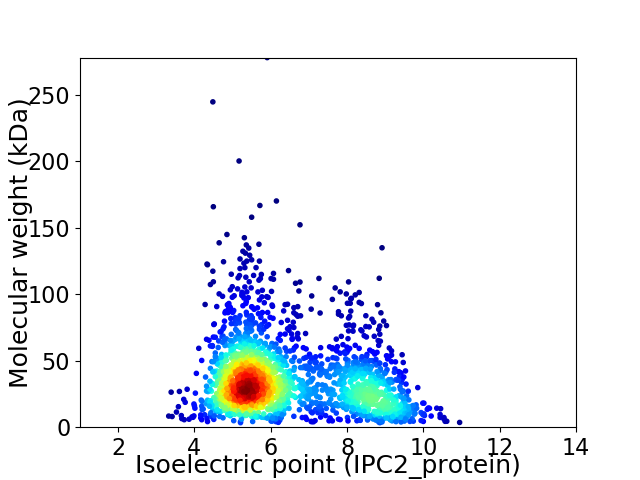
Virtual 2D-PAGE plot for 2076 proteins (isoelectric point calculated using IPC2_protein)
Get csv file with sequences according to given criteria:
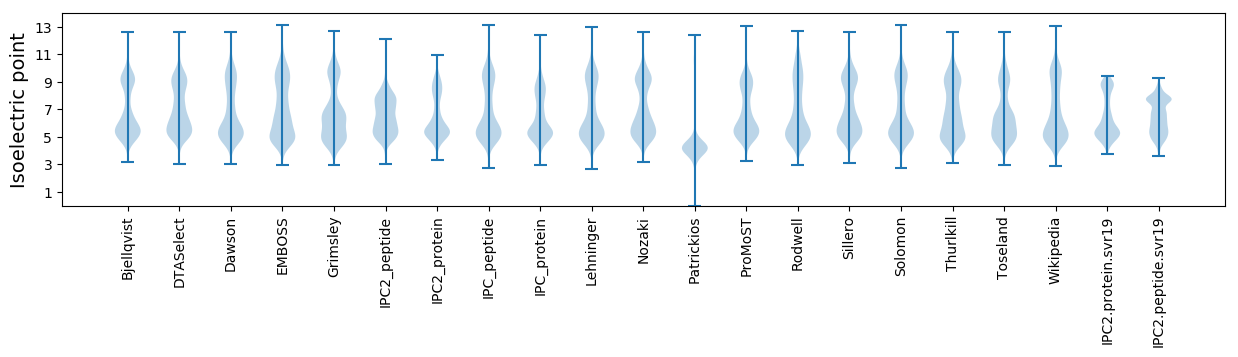
* You can choose from 21 different methods for calculating isoelectric point
Summary statistics related to proteome-wise predictions
Protein with the lowest isoelectric point:
>tr|R7HR13|R7HR13_9BACT Uncharacterized protein OS=Prevotella sp. CAG:279 OX=1262924 GN=BN585_00723 PE=4 SV=1
MM1 pKa = 8.07DD2 pKa = 5.5KK3 pKa = 10.85YY4 pKa = 11.05ICTVCDD10 pKa = 3.11WVYY13 pKa = 11.18DD14 pKa = 4.0PEE16 pKa = 6.07IGDD19 pKa = 4.19PEE21 pKa = 4.96HH22 pKa = 7.12GIAPGTKK29 pKa = 9.81FEE31 pKa = 6.11DD32 pKa = 4.08IPDD35 pKa = 3.66DD36 pKa = 4.07WVCPLCGVGKK46 pKa = 10.53EE47 pKa = 4.11DD48 pKa = 5.13FEE50 pKa = 6.84KK51 pKa = 10.4IDD53 pKa = 3.3
MM1 pKa = 8.07DD2 pKa = 5.5KK3 pKa = 10.85YY4 pKa = 11.05ICTVCDD10 pKa = 3.11WVYY13 pKa = 11.18DD14 pKa = 4.0PEE16 pKa = 6.07IGDD19 pKa = 4.19PEE21 pKa = 4.96HH22 pKa = 7.12GIAPGTKK29 pKa = 9.81FEE31 pKa = 6.11DD32 pKa = 4.08IPDD35 pKa = 3.66DD36 pKa = 4.07WVCPLCGVGKK46 pKa = 10.53EE47 pKa = 4.11DD48 pKa = 5.13FEE50 pKa = 6.84KK51 pKa = 10.4IDD53 pKa = 3.3
Molecular weight: 6.01 kDa
Isoelectric point according different methods:
Protein with the highest isoelectric point:
>tr|R7HN07|R7HN07_9BACT C-terminal processing peptidase OS=Prevotella sp. CAG:279 OX=1262924 GN=BN585_01673 PE=3 SV=1
MM1 pKa = 7.84PSGKK5 pKa = 9.36KK6 pKa = 9.96RR7 pKa = 11.84KK8 pKa = 6.44GHH10 pKa = 6.2KK11 pKa = 9.14MATHH15 pKa = 6.13KK16 pKa = 10.39RR17 pKa = 11.84KK18 pKa = 9.84KK19 pKa = 9.28RR20 pKa = 11.84LRR22 pKa = 11.84KK23 pKa = 9.26NRR25 pKa = 11.84HH26 pKa = 4.71KK27 pKa = 10.87KK28 pKa = 9.36KK29 pKa = 10.77
MM1 pKa = 7.84PSGKK5 pKa = 9.36KK6 pKa = 9.96RR7 pKa = 11.84KK8 pKa = 6.44GHH10 pKa = 6.2KK11 pKa = 9.14MATHH15 pKa = 6.13KK16 pKa = 10.39RR17 pKa = 11.84KK18 pKa = 9.84KK19 pKa = 9.28RR20 pKa = 11.84LRR22 pKa = 11.84KK23 pKa = 9.26NRR25 pKa = 11.84HH26 pKa = 4.71KK27 pKa = 10.87KK28 pKa = 9.36KK29 pKa = 10.77
Molecular weight: 3.58 kDa
Isoelectric point according different methods:
Peptides (in silico digests for buttom-up proteomics)
Below you can find in silico digests of the whole proteome with Trypsin, Chymotrypsin, Trypsin+LysC, LysN, ArgC proteases suitable for different mass spec machines.| Try ESI |
 |
|---|
| ChTry ESI |
|
|---|
| ArgC ESI |
|
|---|
| LysN ESI |
|
|---|
| TryLysC ESI |
|
|---|
| Try MALDI |
|
|---|
| ChTry MALDI |
|
|---|
| ArgC MALDI |
|
|---|
| LysN MALDI |
|
|---|
| TryLysC MALDI |
|
|---|
| Try LTQ |
|
|---|
| ChTry LTQ |
|
|---|
| ArgC LTQ |
|
|---|
| LysN LTQ |
|
|---|
| TryLysC LTQ |
|
|---|
| Try MSlow |
|
|---|
| ChTry MSlow |
|
|---|
| ArgC MSlow |
|
|---|
| LysN MSlow |
|
|---|
| TryLysC MSlow |
|
|---|
| Try MShigh |
|
|---|
| ChTry MShigh |
|
|---|
| ArgC MShigh |
|
|---|
| LysN MShigh |
|
|---|
| TryLysC MShigh |
|
|---|
General Statistics
Number of major isoforms |
Number of additional isoforms |
Number of all proteins |
Number of amino acids |
Min. Seq. Length |
Max. Seq. Length |
Avg. Seq. Length |
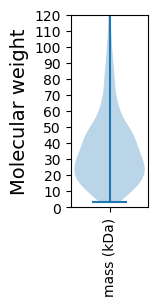
Avg. Mol. Weight |
|---|---|---|---|---|---|---|---|
0 |
709329 |
29 |
2467 |
341.7 |
38.12 |
Amino acid frequency
Ala |
Cys |
Asp |
Glu |
Phe |
Gly |
His |
Ile |
Lys |
Leu |
|---|---|---|---|---|---|---|---|---|---|
8.416 ± 0.063 | 1.323 ± 0.02 |
6.082 ± 0.042 | 6.014 ± 0.045 |
4.458 ± 0.036 | 7.041 ± 0.045 |
1.823 ± 0.028 | 6.436 ± 0.049 |
6.179 ± 0.052 | 8.559 ± 0.056 |
Met |
Asn |
Gln |
Pro |
Arg |
Ser |
Thr |
Val |
Trp |
Tyr |
|---|---|---|---|---|---|---|---|---|---|
2.805 ± 0.028 | 4.835 ± 0.045 |
3.631 ± 0.026 | 3.034 ± 0.029 |
4.968 ± 0.048 | 6.3 ± 0.046 |
5.65 ± 0.044 | 7.311 ± 0.042 |
1.105 ± 0.019 | 4.027 ± 0.036 |
Most of the basic statistics you can see at this page can be downloaded from this CSV file
See this proteome in:

Proteome-pI is available under Creative Commons Attribution-NoDerivs license, for more details see here
| Reference: Kozlowski LP. Proteome-pI 2.0: Proteome Isoelectric Point Database Update. Nucleic Acids Res. 2021, doi: 10.1093/nar/gkab944 | Contact: Lukasz P. Kozlowski |