Sphingobacterium sp. IITKGP-BTPF85
Taxonomy: cellular organisms; Bacteria; FCB group; Bacteroidetes/Chlorobi group; Bacteroidetes; Sphingobacteriia; Sphingobacteriales; Sphingobacteriaceae; Sphingobacterium; unclassified Sphingobacterium
Average proteome isoelectric point is 6.78
Get precalculated fractions of proteins
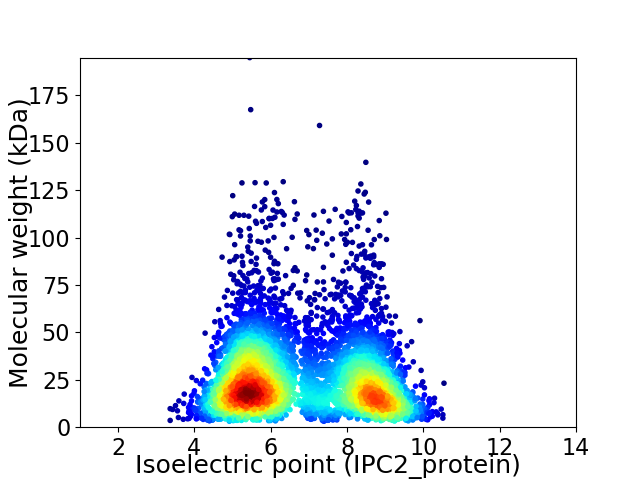
Virtual 2D-PAGE plot for 6019 proteins (isoelectric point calculated using IPC2_protein)
Get csv file with sequences according to given criteria:
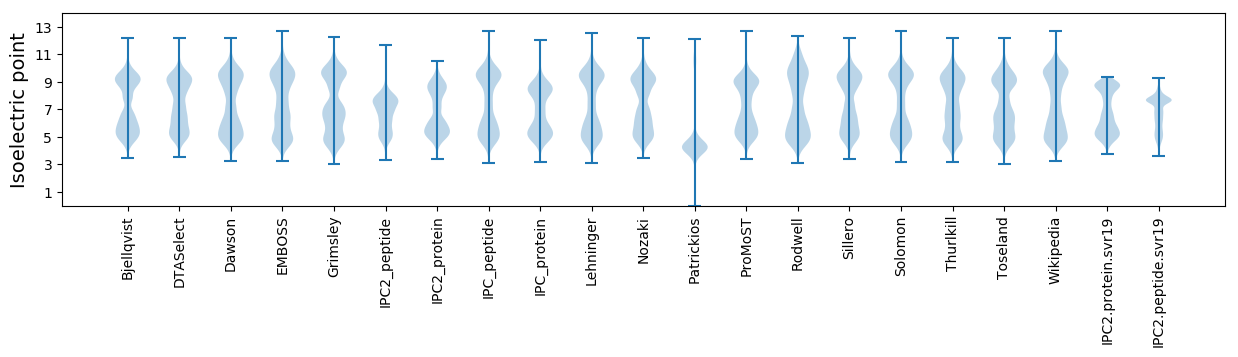
* You can choose from 21 different methods for calculating isoelectric point
Summary statistics related to proteome-wise predictions
Protein with the lowest isoelectric point:
>tr|A0A0M3C3V2|A0A0M3C3V2_9SPHI Uncharacterized protein OS=Sphingobacterium sp. IITKGP-BTPF85 OX=1338009 GN=L950_0226845 PE=4 SV=1
MM1 pKa = 7.54SLTEE5 pKa = 3.9YY6 pKa = 10.46LDD8 pKa = 4.06YY9 pKa = 11.29VILPILILSTVITFIRR25 pKa = 11.84LFKK28 pKa = 11.02GPDD31 pKa = 2.97VADD34 pKa = 3.63RR35 pKa = 11.84VIALDD40 pKa = 4.53LIITTGIGIITVYY53 pKa = 10.69SITTSQEE60 pKa = 3.1IFLDD64 pKa = 3.48VAMILALIAFLGTIAFAYY82 pKa = 10.24YY83 pKa = 10.45LEE85 pKa = 4.42KK86 pKa = 10.25QDD88 pKa = 4.79YY89 pKa = 10.61NDD91 pKa = 3.28
MM1 pKa = 7.54SLTEE5 pKa = 3.9YY6 pKa = 10.46LDD8 pKa = 4.06YY9 pKa = 11.29VILPILILSTVITFIRR25 pKa = 11.84LFKK28 pKa = 11.02GPDD31 pKa = 2.97VADD34 pKa = 3.63RR35 pKa = 11.84VIALDD40 pKa = 4.53LIITTGIGIITVYY53 pKa = 10.69SITTSQEE60 pKa = 3.1IFLDD64 pKa = 3.48VAMILALIAFLGTIAFAYY82 pKa = 10.24YY83 pKa = 10.45LEE85 pKa = 4.42KK86 pKa = 10.25QDD88 pKa = 4.79YY89 pKa = 10.61NDD91 pKa = 3.28
Molecular weight: 10.18 kDa
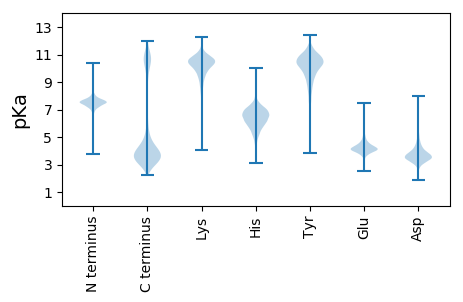
Isoelectric point according different methods:
Protein with the highest isoelectric point:
>tr|A0A0M3CEP9|A0A0M3CEP9_9SPHI Uncharacterized protein OS=Sphingobacterium sp. IITKGP-BTPF85 OX=1338009 GN=L950_0212965 PE=4 SV=1
MM1 pKa = 7.67KK2 pKa = 10.59LNDD5 pKa = 3.48IRR7 pKa = 11.84FGALGGTICSIWASFSFGDD26 pKa = 3.93ILQTVCMAAVGTIVSYY42 pKa = 9.11ITSRR46 pKa = 11.84LVSRR50 pKa = 11.84IRR52 pKa = 11.84KK53 pKa = 8.76RR54 pKa = 3.21
MM1 pKa = 7.67KK2 pKa = 10.59LNDD5 pKa = 3.48IRR7 pKa = 11.84FGALGGTICSIWASFSFGDD26 pKa = 3.93ILQTVCMAAVGTIVSYY42 pKa = 9.11ITSRR46 pKa = 11.84LVSRR50 pKa = 11.84IRR52 pKa = 11.84KK53 pKa = 8.76RR54 pKa = 3.21
Molecular weight: 5.93 kDa
Isoelectric point according different methods:
Peptides (in silico digests for buttom-up proteomics)
Below you can find in silico digests of the whole proteome with Trypsin, Chymotrypsin, Trypsin+LysC, LysN, ArgC proteases suitable for different mass spec machines.| Try ESI |
 |
|---|
| ChTry ESI |
|
|---|
| ArgC ESI |
|
|---|
| LysN ESI |
|
|---|
| TryLysC ESI |
|
|---|
| Try MALDI |
|
|---|
| ChTry MALDI |
|
|---|
| ArgC MALDI |
|
|---|
| LysN MALDI |
|
|---|
| TryLysC MALDI |
|
|---|
| Try LTQ |
|
|---|
| ChTry LTQ |
|
|---|
| ArgC LTQ |
|
|---|
| LysN LTQ |
|
|---|
| TryLysC LTQ |
|
|---|
| Try MSlow |
|
|---|
| ChTry MSlow |
|
|---|
| ArgC MSlow |
|
|---|
| LysN MSlow |
|
|---|
| TryLysC MSlow |
|
|---|
| Try MShigh |
|
|---|
| ChTry MShigh |
|
|---|
| ArgC MShigh |
|
|---|
| LysN MShigh |
|
|---|
| TryLysC MShigh |
|
|---|
General Statistics
Number of major isoforms |
Number of additional isoforms |
Number of all proteins |
Number of amino acids |
Min. Seq. Length |
Max. Seq. Length |
Avg. Seq. Length |
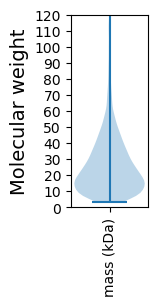
Avg. Mol. Weight |
|---|---|---|---|---|---|---|---|
0 |
1462207 |
29 |
1743 |
242.9 |
27.45 |
Amino acid frequency
Ala |
Cys |
Asp |
Glu |
Phe |
Gly |
His |
Ile |
Lys |
Leu |
|---|---|---|---|---|---|---|---|---|---|
6.698 ± 0.033 | 0.757 ± 0.01 |
5.416 ± 0.024 | 5.946 ± 0.031 |
4.991 ± 0.027 | 6.374 ± 0.032 |
1.926 ± 0.016 | 7.863 ± 0.04 |
7.348 ± 0.031 | 9.683 ± 0.041 |
Met |
Asn |
Gln |
Pro |
Arg |
Ser |
Thr |
Val |
Trp |
Tyr |
|---|---|---|---|---|---|---|---|---|---|
2.42 ± 0.017 | 5.828 ± 0.035 |
3.474 ± 0.019 | 3.905 ± 0.021 |
3.802 ± 0.021 | 6.56 ± 0.026 |
5.482 ± 0.023 | 6.078 ± 0.029 |
1.195 ± 0.013 | 4.255 ± 0.027 |
Most of the basic statistics you can see at this page can be downloaded from this CSV file
See this proteome in:

Proteome-pI is available under Creative Commons Attribution-NoDerivs license, for more details see here
| Reference: Kozlowski LP. Proteome-pI 2.0: Proteome Isoelectric Point Database Update. Nucleic Acids Res. 2021, doi: 10.1093/nar/gkab944 | Contact: Lukasz P. Kozlowski |