Bacillus virus AP50
Taxonomy: Viruses; Varidnaviria; Bamfordvirae; Preplasmiviricota; Tectiliviricetes; Kalamavirales; Tectiviridae; Betatectivirus
Average proteome isoelectric point is 6.77
Get precalculated fractions of proteins
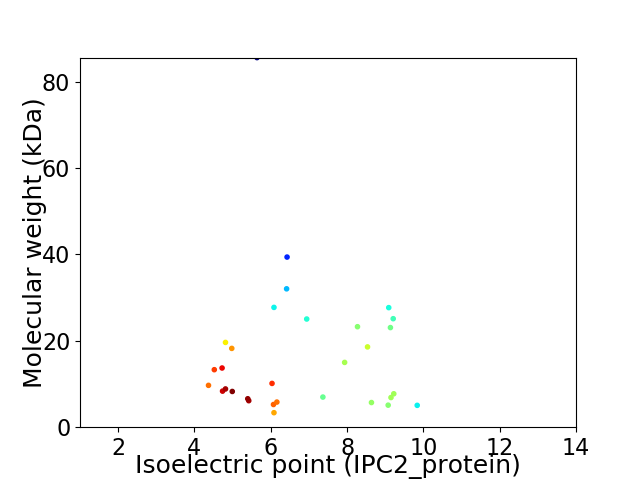
Virtual 2D-PAGE plot for 31 proteins (isoelectric point calculated using IPC2_protein)
Get csv file with sequences according to given criteria:
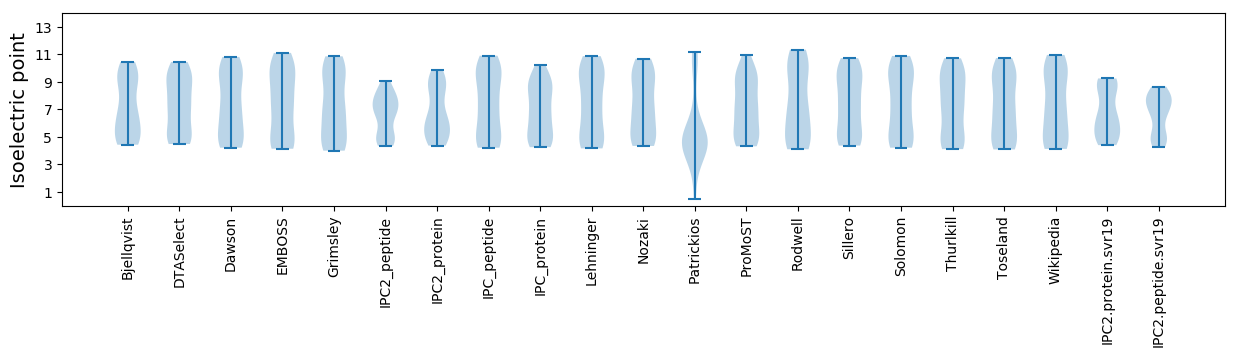
* You can choose from 21 different methods for calculating isoelectric point
Summary statistics related to proteome-wise predictions
Protein with the lowest isoelectric point:
>tr|B6RT46|B6RT46_9VIRU DNA packaging ATPase OS=Bacillus virus AP50 OX=513550 PE=4 SV=1
MM1 pKa = 7.96LDD3 pKa = 3.45QIQIPNEE10 pKa = 3.98NKK12 pKa = 9.58EE13 pKa = 4.44SKK15 pKa = 9.58QEE17 pKa = 3.86RR18 pKa = 11.84LQLVVDD24 pKa = 3.79QVVDD28 pKa = 3.74SLPTTVRR35 pKa = 11.84LLAGSYY41 pKa = 10.45LNSFRR46 pKa = 11.84QVLEE50 pKa = 4.32SEE52 pKa = 4.17QHH54 pKa = 7.05DD55 pKa = 3.29IDD57 pKa = 4.84GNIDD61 pKa = 3.54LALSRR66 pKa = 11.84LRR68 pKa = 11.84EE69 pKa = 4.19YY70 pKa = 10.41IDD72 pKa = 3.81YY73 pKa = 10.24IQYY76 pKa = 10.89GHH78 pKa = 6.39DD79 pKa = 3.6QEE81 pKa = 5.88NEE83 pKa = 3.7
MM1 pKa = 7.96LDD3 pKa = 3.45QIQIPNEE10 pKa = 3.98NKK12 pKa = 9.58EE13 pKa = 4.44SKK15 pKa = 9.58QEE17 pKa = 3.86RR18 pKa = 11.84LQLVVDD24 pKa = 3.79QVVDD28 pKa = 3.74SLPTTVRR35 pKa = 11.84LLAGSYY41 pKa = 10.45LNSFRR46 pKa = 11.84QVLEE50 pKa = 4.32SEE52 pKa = 4.17QHH54 pKa = 7.05DD55 pKa = 3.29IDD57 pKa = 4.84GNIDD61 pKa = 3.54LALSRR66 pKa = 11.84LRR68 pKa = 11.84EE69 pKa = 4.19YY70 pKa = 10.41IDD72 pKa = 3.81YY73 pKa = 10.24IQYY76 pKa = 10.89GHH78 pKa = 6.39DD79 pKa = 3.6QEE81 pKa = 5.88NEE83 pKa = 3.7
Molecular weight: 9.69 kDa
Isoelectric point according different methods:
Protein with the highest isoelectric point:
>tr|B6RT55|B6RT55_9VIRU Minor capsid protein OS=Bacillus virus AP50 OX=513550 PE=4 SV=1
MM1 pKa = 7.22SRR3 pKa = 11.84VLGIVSGIGMLIAVYY18 pKa = 10.52LFLNNAKK25 pKa = 8.46QTTQIIDD32 pKa = 3.81SIAGNGVKK40 pKa = 10.26GIKK43 pKa = 8.69TLQGRR48 pKa = 3.88
MM1 pKa = 7.22SRR3 pKa = 11.84VLGIVSGIGMLIAVYY18 pKa = 10.52LFLNNAKK25 pKa = 8.46QTTQIIDD32 pKa = 3.81SIAGNGVKK40 pKa = 10.26GIKK43 pKa = 8.69TLQGRR48 pKa = 3.88
Molecular weight: 5.06 kDa
Isoelectric point according different methods:
Peptides (in silico digests for buttom-up proteomics)
Below you can find in silico digests of the whole proteome with Trypsin, Chymotrypsin, Trypsin+LysC, LysN, ArgC proteases suitable for different mass spec machines.| Try ESI |
 |
|---|
| ChTry ESI |
|
|---|
| ArgC ESI |
|
|---|
| LysN ESI |
|
|---|
| TryLysC ESI |
|
|---|
| Try MALDI |
|
|---|
| ChTry MALDI |
|
|---|
| ArgC MALDI |
|
|---|
| LysN MALDI |
|
|---|
| TryLysC MALDI |
|
|---|
| Try LTQ |
|
|---|
| ChTry LTQ |
|
|---|
| ArgC LTQ |
|
|---|
| LysN LTQ |
|
|---|
| TryLysC LTQ |
|
|---|
| Try MSlow |
|
|---|
| ChTry MSlow |
|
|---|
| ArgC MSlow |
|
|---|
| LysN MSlow |
|
|---|
| TryLysC MSlow |
|
|---|
| Try MShigh |
|
|---|
| ChTry MShigh |
|
|---|
| ArgC MShigh |
|
|---|
| LysN MShigh |
|
|---|
| TryLysC MShigh |
|
|---|
General Statistics
Number of major isoforms |
Number of additional isoforms |
Number of all proteins |
Number of amino acids |
Min. Seq. Length |
Max. Seq. Length |
Avg. Seq. Length |
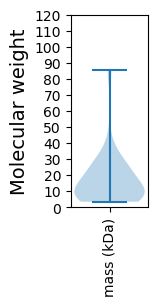
Avg. Mol. Weight |
|---|---|---|---|---|---|---|---|
0 |
4590 |
29 |
731 |
148.1 |
16.69 |
Amino acid frequency
Ala |
Cys |
Asp |
Glu |
Phe |
Gly |
His |
Ile |
Lys |
Leu |
|---|---|---|---|---|---|---|---|---|---|
6.013 ± 0.535 | 0.654 ± 0.173 |
5.948 ± 0.49 | 6.885 ± 0.829 |
4.532 ± 0.333 | 7.32 ± 0.647 |
1.656 ± 0.248 | 5.817 ± 0.358 |
8.606 ± 0.62 | 8.279 ± 0.511 |
Met |
Asn |
Gln |
Pro |
Arg |
Ser |
Thr |
Val |
Trp |
Tyr |
|---|---|---|---|---|---|---|---|---|---|
3.29 ± 0.303 | 5.098 ± 0.374 |
3.682 ± 0.442 | 4.248 ± 0.415 |
4.052 ± 0.286 | 6.122 ± 0.551 |
6.144 ± 0.414 | 6.972 ± 0.443 |
0.98 ± 0.158 | 3.704 ± 0.541 |
Most of the basic statistics you can see at this page can be downloaded from this CSV file
See this proteome in:

Proteome-pI is available under Creative Commons Attribution-NoDerivs license, for more details see here
| Reference: Kozlowski LP. Proteome-pI 2.0: Proteome Isoelectric Point Database Update. Nucleic Acids Res. 2021, doi: 10.1093/nar/gkab944 | Contact: Lukasz P. Kozlowski |