Synergistes sp. 3_1_syn1
Taxonomy: cellular organisms; Bacteria; Synergistetes; Synergistia; Synergistales; Synergistaceae; Synergistes; unclassified Synergistes
Average proteome isoelectric point is 6.46
Get precalculated fractions of proteins
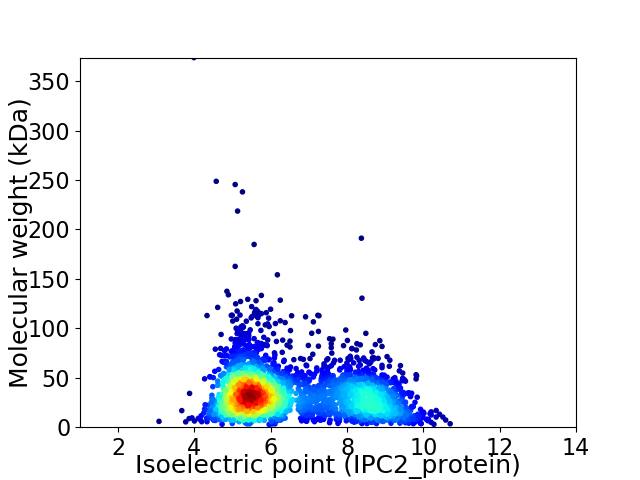
Virtual 2D-PAGE plot for 2957 proteins (isoelectric point calculated using IPC2_protein)
Get csv file with sequences according to given criteria:
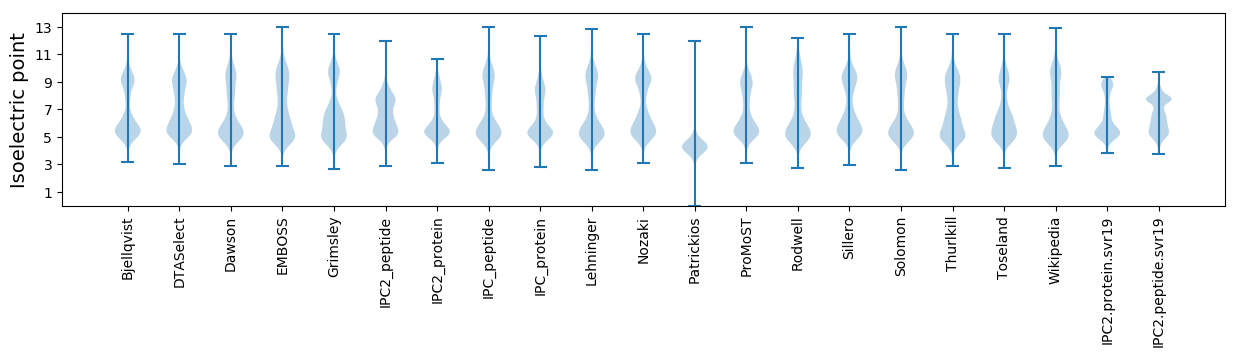
* You can choose from 21 different methods for calculating isoelectric point
Summary statistics related to proteome-wise predictions
Protein with the lowest isoelectric point:
>tr|G9PWS1|G9PWS1_9BACT Uncharacterized protein OS=Synergistes sp. 3_1_syn1 OX=457415 GN=HMPREF1006_00083 PE=4 SV=1
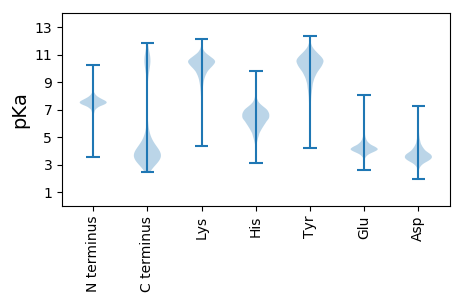
MM1 pKa = 7.58GIKK4 pKa = 10.38VNLDD8 pKa = 3.26DD9 pKa = 6.49CIGCGVCFEE18 pKa = 5.2LCPQNFKK25 pKa = 10.91LDD27 pKa = 3.85EE28 pKa = 4.72DD29 pKa = 3.87EE30 pKa = 4.61GKK32 pKa = 11.14CMVISNEE39 pKa = 4.08VNSSAKK45 pKa = 9.65EE46 pKa = 3.83AADD49 pKa = 3.68SCPVSAITIDD59 pKa = 3.17
MM1 pKa = 7.58GIKK4 pKa = 10.38VNLDD8 pKa = 3.26DD9 pKa = 6.49CIGCGVCFEE18 pKa = 5.2LCPQNFKK25 pKa = 10.91LDD27 pKa = 3.85EE28 pKa = 4.72DD29 pKa = 3.87EE30 pKa = 4.61GKK32 pKa = 11.14CMVISNEE39 pKa = 4.08VNSSAKK45 pKa = 9.65EE46 pKa = 3.83AADD49 pKa = 3.68SCPVSAITIDD59 pKa = 3.17
Molecular weight: 6.27 kDa
Isoelectric point according different methods:
Protein with the highest isoelectric point:
>tr|G9PUR7|G9PUR7_9BACT Sodium ion-translocating decarboxylase beta subunit OS=Synergistes sp. 3_1_syn1 OX=457415 GN=HMPREF1006_02565 PE=4 SV=1
EEE2 pKa = 4.76EEE4 pKa = 4.02EEE6 pKa = 4.23IQGRR10 pKa = 11.84KKK12 pKa = 9.33IYYY15 pKa = 9.29CLYYY19 pKa = 9.91DD20 pKa = 4.24IVIKKK25 pKa = 10.37RR26 pKa = 11.84KKK28 pKa = 8.03
EEE2 pKa = 4.76EEE4 pKa = 4.02EEE6 pKa = 4.23IQGRR10 pKa = 11.84KKK12 pKa = 9.33IYYY15 pKa = 9.29CLYYY19 pKa = 9.91DD20 pKa = 4.24IVIKKK25 pKa = 10.37RR26 pKa = 11.84KKK28 pKa = 8.03
Molecular weight: 3.58 kDa
Isoelectric point according different methods:
Peptides (in silico digests for buttom-up proteomics)
Below you can find in silico digests of the whole proteome with Trypsin, Chymotrypsin, Trypsin+LysC, LysN, ArgC proteases suitable for different mass spec machines.| Try ESI |
 |
|---|
| ChTry ESI |
|
|---|
| ArgC ESI |
|
|---|
| LysN ESI |
|
|---|
| TryLysC ESI |
|
|---|
| Try MALDI |
|
|---|
| ChTry MALDI |
|
|---|
| ArgC MALDI |
|
|---|
| LysN MALDI |
|
|---|
| TryLysC MALDI |
|
|---|
| Try LTQ |
|
|---|
| ChTry LTQ |
|
|---|
| ArgC LTQ |
|
|---|
| LysN LTQ |
|
|---|
| TryLysC LTQ |
|
|---|
| Try MSlow |
|
|---|
| ChTry MSlow |
|
|---|
| ArgC MSlow |
|
|---|
| LysN MSlow |
|
|---|
| TryLysC MSlow |
|
|---|
| Try MShigh |
|
|---|
| ChTry MShigh |
|
|---|
| ArgC MShigh |
|
|---|
| LysN MShigh |
|
|---|
| TryLysC MShigh |
|
|---|
General Statistics
Number of major isoforms |
Number of additional isoforms |
Number of all proteins |
Number of amino acids |
Min. Seq. Length |
Max. Seq. Length |
Avg. Seq. Length |
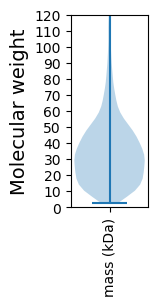
Avg. Mol. Weight |
|---|---|---|---|---|---|---|---|
0 |
957959 |
25 |
3571 |
324.0 |
35.61 |
Amino acid frequency
Ala |
Cys |
Asp |
Glu |
Phe |
Gly |
His |
Ile |
Lys |
Leu |
|---|---|---|---|---|---|---|---|---|---|
10.142 ± 0.052 | 1.531 ± 0.019 |
5.198 ± 0.038 | 6.883 ± 0.047 |
4.115 ± 0.033 | 8.329 ± 0.048 |
1.604 ± 0.017 | 6.498 ± 0.036 |
5.564 ± 0.04 | 9.47 ± 0.056 |
Met |
Asn |
Gln |
Pro |
Arg |
Ser |
Thr |
Val |
Trp |
Tyr |
|---|---|---|---|---|---|---|---|---|---|
2.952 ± 0.021 | 3.36 ± 0.025 |
4.179 ± 0.023 | 2.349 ± 0.025 |
5.736 ± 0.042 | 5.878 ± 0.035 |
4.976 ± 0.041 | 6.968 ± 0.037 |
1.115 ± 0.018 | 3.156 ± 0.029 |
Most of the basic statistics you can see at this page can be downloaded from this CSV file
See this proteome in:

Proteome-pI is available under Creative Commons Attribution-NoDerivs license, for more details see here
| Reference: Kozlowski LP. Proteome-pI 2.0: Proteome Isoelectric Point Database Update. Nucleic Acids Res. 2021, doi: 10.1093/nar/gkab944 | Contact: Lukasz P. Kozlowski |