Rufibacter tibetensis
Taxonomy: cellular organisms; Bacteria; FCB group; Bacteroidetes/Chlorobi group; Bacteroidetes; Cytophagia; Cytophagales; Hymenobacteraceae; Rufibacter
Average proteome isoelectric point is 6.66
Get precalculated fractions of proteins
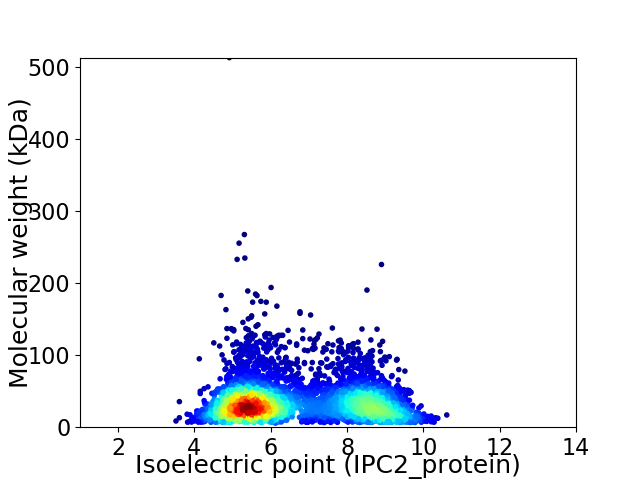
Virtual 2D-PAGE plot for 4108 proteins (isoelectric point calculated using IPC2_protein)
Get csv file with sequences according to given criteria:
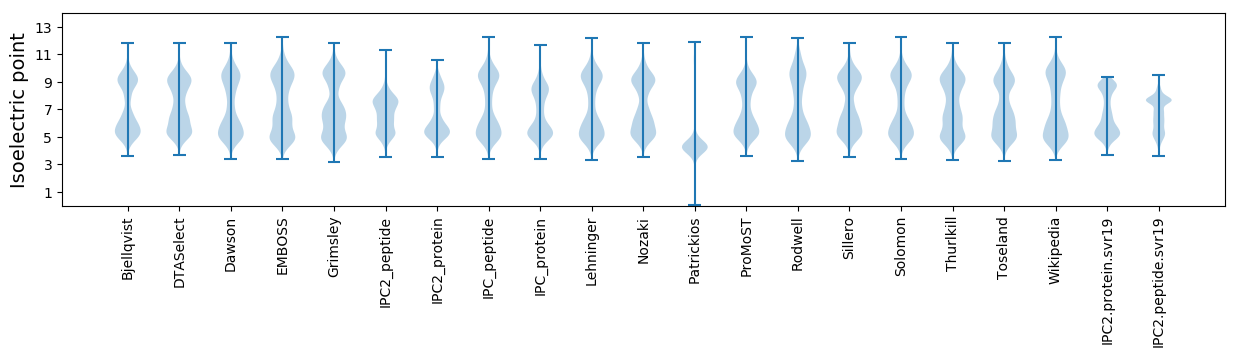
* You can choose from 21 different methods for calculating isoelectric point
Summary statistics related to proteome-wise predictions
Protein with the lowest isoelectric point:
>tr|A0A0P0CY26|A0A0P0CY26_9BACT Histidine ammonia-lyase OS=Rufibacter tibetensis OX=512763 GN=DC20_16740 PE=3 SV=1
MM1 pKa = 7.59KK2 pKa = 10.54KK3 pKa = 10.47FGLHH7 pKa = 5.24TLLAGLCLFAFSCNEE22 pKa = 4.12EE23 pKa = 4.15EE24 pKa = 4.44PQDD27 pKa = 3.68AVTPSSSKK35 pKa = 10.65EE36 pKa = 3.28ITAAGGIKK44 pKa = 10.29PNGSSLEE51 pKa = 4.09TSASKK56 pKa = 10.05MIQGQDD62 pKa = 3.25LASTSGSCTLIDD74 pKa = 4.22FNSLTSGLLAPGAFAAQGVSITTGPNGTTGSVSVLSGFNLNGCGGPSLQTIPFTGPSVLFNFSEE138 pKa = 4.32PVISVSLTSGDD149 pKa = 3.53FAGDD153 pKa = 3.21EE154 pKa = 4.14DD155 pKa = 5.33VITVRR160 pKa = 11.84AYY162 pKa = 10.48SGEE165 pKa = 4.17NAGGTVLASQTMTLASGLIKK185 pKa = 10.53CLQFYY190 pKa = 11.05LEE192 pKa = 4.13ASGIRR197 pKa = 11.84SVEE200 pKa = 4.02VTSAGIFPNSVFVDD214 pKa = 3.41NLEE217 pKa = 4.13FCLNEE222 pKa = 4.35DD223 pKa = 3.69TDD225 pKa = 4.46SDD227 pKa = 4.31GVNDD231 pKa = 5.79DD232 pKa = 4.47EE233 pKa = 5.87DD234 pKa = 4.06NCPSLSNPGQEE245 pKa = 4.6NNDD248 pKa = 3.22GDD250 pKa = 4.57GLGDD254 pKa = 4.02ACDD257 pKa = 4.58PDD259 pKa = 4.99DD260 pKa = 6.47DD261 pKa = 4.98NDD263 pKa = 4.16GVLDD267 pKa = 4.65ASDD270 pKa = 4.36NCPMLANADD279 pKa = 3.89QLDD282 pKa = 3.95TDD284 pKa = 4.97GDD286 pKa = 4.36GQGNACDD293 pKa = 5.14ADD295 pKa = 4.05DD296 pKa = 5.86DD297 pKa = 4.58NDD299 pKa = 4.17GVVDD303 pKa = 5.19AQDD306 pKa = 4.66CDD308 pKa = 3.87PLSAKK313 pKa = 9.69NDD315 pKa = 3.42KK316 pKa = 10.94VLICHH321 pKa = 7.28KK322 pKa = 10.77GQTLCVAQSAVKK334 pKa = 10.31AHH336 pKa = 6.96LAHH339 pKa = 6.61GDD341 pKa = 3.6EE342 pKa = 5.39VGACGNN348 pKa = 3.73
MM1 pKa = 7.59KK2 pKa = 10.54KK3 pKa = 10.47FGLHH7 pKa = 5.24TLLAGLCLFAFSCNEE22 pKa = 4.12EE23 pKa = 4.15EE24 pKa = 4.44PQDD27 pKa = 3.68AVTPSSSKK35 pKa = 10.65EE36 pKa = 3.28ITAAGGIKK44 pKa = 10.29PNGSSLEE51 pKa = 4.09TSASKK56 pKa = 10.05MIQGQDD62 pKa = 3.25LASTSGSCTLIDD74 pKa = 4.22FNSLTSGLLAPGAFAAQGVSITTGPNGTTGSVSVLSGFNLNGCGGPSLQTIPFTGPSVLFNFSEE138 pKa = 4.32PVISVSLTSGDD149 pKa = 3.53FAGDD153 pKa = 3.21EE154 pKa = 4.14DD155 pKa = 5.33VITVRR160 pKa = 11.84AYY162 pKa = 10.48SGEE165 pKa = 4.17NAGGTVLASQTMTLASGLIKK185 pKa = 10.53CLQFYY190 pKa = 11.05LEE192 pKa = 4.13ASGIRR197 pKa = 11.84SVEE200 pKa = 4.02VTSAGIFPNSVFVDD214 pKa = 3.41NLEE217 pKa = 4.13FCLNEE222 pKa = 4.35DD223 pKa = 3.69TDD225 pKa = 4.46SDD227 pKa = 4.31GVNDD231 pKa = 5.79DD232 pKa = 4.47EE233 pKa = 5.87DD234 pKa = 4.06NCPSLSNPGQEE245 pKa = 4.6NNDD248 pKa = 3.22GDD250 pKa = 4.57GLGDD254 pKa = 4.02ACDD257 pKa = 4.58PDD259 pKa = 4.99DD260 pKa = 6.47DD261 pKa = 4.98NDD263 pKa = 4.16GVLDD267 pKa = 4.65ASDD270 pKa = 4.36NCPMLANADD279 pKa = 3.89QLDD282 pKa = 3.95TDD284 pKa = 4.97GDD286 pKa = 4.36GQGNACDD293 pKa = 5.14ADD295 pKa = 4.05DD296 pKa = 5.86DD297 pKa = 4.58NDD299 pKa = 4.17GVVDD303 pKa = 5.19AQDD306 pKa = 4.66CDD308 pKa = 3.87PLSAKK313 pKa = 9.69NDD315 pKa = 3.42KK316 pKa = 10.94VLICHH321 pKa = 7.28KK322 pKa = 10.77GQTLCVAQSAVKK334 pKa = 10.31AHH336 pKa = 6.96LAHH339 pKa = 6.61GDD341 pKa = 3.6EE342 pKa = 5.39VGACGNN348 pKa = 3.73
Molecular weight: 35.46 kDa
Isoelectric point according different methods:
Protein with the highest isoelectric point:
>tr|A0A0P0D403|A0A0P0D403_9BACT Uncharacterized protein OS=Rufibacter tibetensis OX=512763 GN=DC20_21600 PE=4 SV=1
MM1 pKa = 7.44LWLLPVLVLSSCGTARR17 pKa = 11.84RR18 pKa = 11.84SEE20 pKa = 4.77PIMGPLTLQTQQLEE34 pKa = 4.18NGRR37 pKa = 11.84QVFMQNCQRR46 pKa = 11.84CHH48 pKa = 6.31PLGEE52 pKa = 4.88AGLGPSLNNIPLPGAALRR70 pKa = 11.84FRR72 pKa = 11.84VRR74 pKa = 11.84SKK76 pKa = 11.57AFFLGIGRR84 pKa = 11.84MPSFKK89 pKa = 10.02KK90 pKa = 10.13HH91 pKa = 5.49EE92 pKa = 4.13ISRR95 pKa = 11.84EE96 pKa = 3.92QMDD99 pKa = 4.04EE100 pKa = 3.94LVVYY104 pKa = 9.69LKK106 pKa = 10.75ALRR109 pKa = 11.84RR110 pKa = 11.84HH111 pKa = 5.61KK112 pKa = 10.57RR113 pKa = 11.84SEE115 pKa = 3.8AVAAQQ120 pKa = 3.27
MM1 pKa = 7.44LWLLPVLVLSSCGTARR17 pKa = 11.84RR18 pKa = 11.84SEE20 pKa = 4.77PIMGPLTLQTQQLEE34 pKa = 4.18NGRR37 pKa = 11.84QVFMQNCQRR46 pKa = 11.84CHH48 pKa = 6.31PLGEE52 pKa = 4.88AGLGPSLNNIPLPGAALRR70 pKa = 11.84FRR72 pKa = 11.84VRR74 pKa = 11.84SKK76 pKa = 11.57AFFLGIGRR84 pKa = 11.84MPSFKK89 pKa = 10.02KK90 pKa = 10.13HH91 pKa = 5.49EE92 pKa = 4.13ISRR95 pKa = 11.84EE96 pKa = 3.92QMDD99 pKa = 4.04EE100 pKa = 3.94LVVYY104 pKa = 9.69LKK106 pKa = 10.75ALRR109 pKa = 11.84RR110 pKa = 11.84HH111 pKa = 5.61KK112 pKa = 10.57RR113 pKa = 11.84SEE115 pKa = 3.8AVAAQQ120 pKa = 3.27
Molecular weight: 13.5 kDa
Isoelectric point according different methods:
Peptides (in silico digests for buttom-up proteomics)
Below you can find in silico digests of the whole proteome with Trypsin, Chymotrypsin, Trypsin+LysC, LysN, ArgC proteases suitable for different mass spec machines.| Try ESI |
 |
|---|
| ChTry ESI |
|
|---|
| ArgC ESI |
|
|---|
| LysN ESI |
|
|---|
| TryLysC ESI |
|
|---|
| Try MALDI |
|
|---|
| ChTry MALDI |
|
|---|
| ArgC MALDI |
|
|---|
| LysN MALDI |
|
|---|
| TryLysC MALDI |
|
|---|
| Try LTQ |
|
|---|
| ChTry LTQ |
|
|---|
| ArgC LTQ |
|
|---|
| LysN LTQ |
|
|---|
| TryLysC LTQ |
|
|---|
| Try MSlow |
|
|---|
| ChTry MSlow |
|
|---|
| ArgC MSlow |
|
|---|
| LysN MSlow |
|
|---|
| TryLysC MSlow |
|
|---|
| Try MShigh |
|
|---|
| ChTry MShigh |
|
|---|
| ArgC MShigh |
|
|---|
| LysN MShigh |
|
|---|
| TryLysC MShigh |
|
|---|
General Statistics
Number of major isoforms |
Number of additional isoforms |
Number of all proteins |
Number of amino acids |
Min. Seq. Length |
Max. Seq. Length |
Avg. Seq. Length |
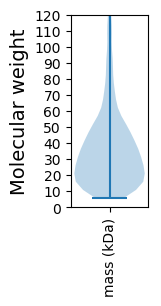
Avg. Mol. Weight |
|---|---|---|---|---|---|---|---|
0 |
1394976 |
51 |
5084 |
339.6 |
37.98 |
Amino acid frequency
Ala |
Cys |
Asp |
Glu |
Phe |
Gly |
His |
Ile |
Lys |
Leu |
|---|---|---|---|---|---|---|---|---|---|
7.855 ± 0.035 | 0.741 ± 0.012 |
4.886 ± 0.026 | 6.302 ± 0.047 |
4.727 ± 0.03 | 7.156 ± 0.045 |
2.038 ± 0.018 | 5.829 ± 0.034 |
6.07 ± 0.039 | 9.974 ± 0.049 |
Met |
Asn |
Gln |
Pro |
Arg |
Ser |
Thr |
Val |
Trp |
Tyr |
|---|---|---|---|---|---|---|---|---|---|
2.304 ± 0.019 | 4.75 ± 0.035 |
4.336 ± 0.026 | 4.423 ± 0.033 |
4.572 ± 0.035 | 6.15 ± 0.034 |
5.929 ± 0.054 | 6.9 ± 0.027 |
1.258 ± 0.017 | 3.799 ± 0.026 |
Most of the basic statistics you can see at this page can be downloaded from this CSV file
See this proteome in:

Proteome-pI is available under Creative Commons Attribution-NoDerivs license, for more details see here
| Reference: Kozlowski LP. Proteome-pI 2.0: Proteome Isoelectric Point Database Update. Nucleic Acids Res. 2021, doi: 10.1093/nar/gkab944 | Contact: Lukasz P. Kozlowski |