Clostridium phage HM2
Taxonomy: Viruses; Duplodnaviria; Heunggongvirae; Uroviricota; Caudoviricetes; Caudovirales; Podoviridae; unclassified Podoviridae
Average proteome isoelectric point is 7.87
Get precalculated fractions of proteins
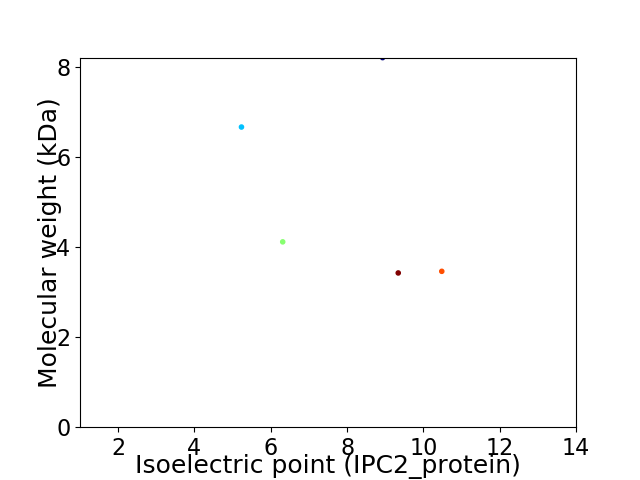
Virtual 2D-PAGE plot for 5 proteins (isoelectric point calculated using IPC2_protein)
Get csv file with sequences according to given criteria:
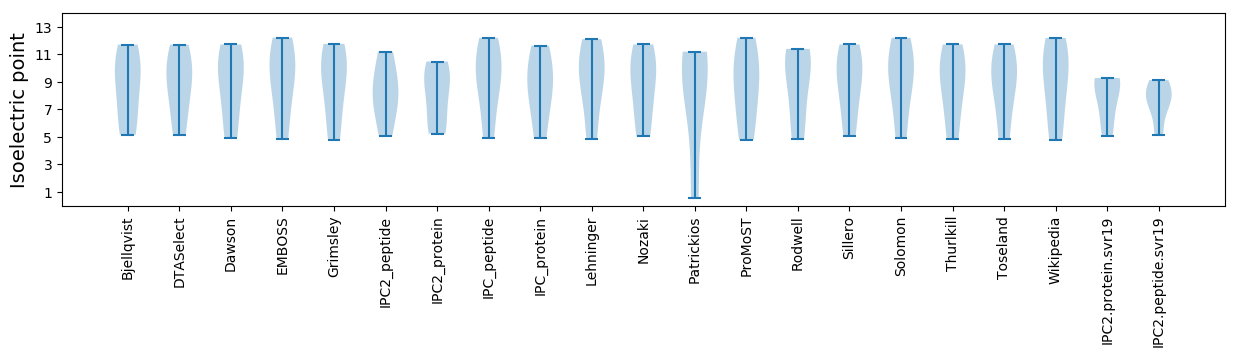
* You can choose from 21 different methods for calculating isoelectric point
Summary statistics related to proteome-wise predictions
Protein with the lowest isoelectric point:
>tr|A0A1C3S7G5|A0A1C3S7G5_9CAUD Uncharacterized protein OS=Clostridium phage HM2 OX=1874333 PE=4 SV=1
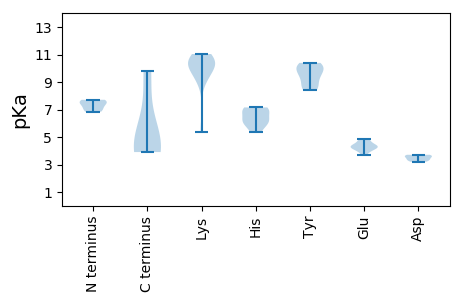
MM1 pKa = 7.57LKK3 pKa = 10.09LHH5 pKa = 6.3YY6 pKa = 9.78IIPGYY11 pKa = 10.3KK12 pKa = 9.26IIKK15 pKa = 5.4TTSNYY20 pKa = 9.35KK21 pKa = 10.33PNVGDD26 pKa = 3.7AVVLIITEE34 pKa = 4.33YY35 pKa = 8.83IVTYY39 pKa = 8.7ITYY42 pKa = 10.07DD43 pKa = 3.21INNDD47 pKa = 3.38IINIYY52 pKa = 10.32CEE54 pKa = 4.07EE55 pKa = 4.25KK56 pKa = 10.56EE57 pKa = 4.1
MM1 pKa = 7.57LKK3 pKa = 10.09LHH5 pKa = 6.3YY6 pKa = 9.78IIPGYY11 pKa = 10.3KK12 pKa = 9.26IIKK15 pKa = 5.4TTSNYY20 pKa = 9.35KK21 pKa = 10.33PNVGDD26 pKa = 3.7AVVLIITEE34 pKa = 4.33YY35 pKa = 8.83IVTYY39 pKa = 8.7ITYY42 pKa = 10.07DD43 pKa = 3.21INNDD47 pKa = 3.38IINIYY52 pKa = 10.32CEE54 pKa = 4.07EE55 pKa = 4.25KK56 pKa = 10.56EE57 pKa = 4.1
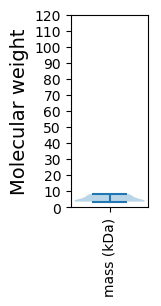
Molecular weight: 6.67 kDa
Isoelectric point according different methods:
Protein with the highest isoelectric point:
>tr|A0A1C3S7V0|A0A1C3S7V0_9CAUD Uncharacterized protein OS=Clostridium phage HM2 OX=1874333 PE=4 SV=1
MM1 pKa = 6.84CTNRR5 pKa = 11.84GHH7 pKa = 6.83LRR9 pKa = 11.84NMSSVRR15 pKa = 11.84IHH17 pKa = 7.12DD18 pKa = 3.71RR19 pKa = 11.84GGEE22 pKa = 4.03YY23 pKa = 10.12IPNNGNKK30 pKa = 9.79
MM1 pKa = 6.84CTNRR5 pKa = 11.84GHH7 pKa = 6.83LRR9 pKa = 11.84NMSSVRR15 pKa = 11.84IHH17 pKa = 7.12DD18 pKa = 3.71RR19 pKa = 11.84GGEE22 pKa = 4.03YY23 pKa = 10.12IPNNGNKK30 pKa = 9.79
Molecular weight: 3.43 kDa
Isoelectric point according different methods:
Peptides (in silico digests for buttom-up proteomics)
Below you can find in silico digests of the whole proteome with Trypsin, Chymotrypsin, Trypsin+LysC, LysN, ArgC proteases suitable for different mass spec machines.| Try ESI |
 |
|---|
| ChTry ESI |
|
|---|
| ArgC ESI |
|
|---|
| LysN ESI |
|
|---|
| TryLysC ESI |
|
|---|
| Try MALDI |
|
|---|
| ChTry MALDI |
|
|---|
| ArgC MALDI |
|
|---|
| LysN MALDI |
|
|---|
| TryLysC MALDI |
|
|---|
| Try LTQ |
|
|---|
| ChTry LTQ |
|
|---|
| ArgC LTQ |
|
|---|
| LysN LTQ |
|
|---|
| TryLysC LTQ |
|
|---|
| Try MSlow |
|
|---|
| ChTry MSlow |
|
|---|
| ArgC MSlow |
|
|---|
| LysN MSlow |
|
|---|
| TryLysC MSlow |
|
|---|
| Try MShigh |
|
|---|
| ChTry MShigh |
|
|---|
| ArgC MShigh |
|
|---|
| LysN MShigh |
|
|---|
| TryLysC MShigh |
|
|---|
General Statistics
Number of major isoforms |
Number of additional isoforms |
Number of all proteins |
Number of amino acids |
Min. Seq. Length |
Max. Seq. Length |
Avg. Seq. Length |
Avg. Mol. Weight |
|---|---|---|---|---|---|---|---|
0 |
217 |
28 |
68 |
43.4 |
5.18 |
Amino acid frequency
Ala |
Cys |
Asp |
Glu |
Phe |
Gly |
His |
Ile |
Lys |
Leu |
|---|---|---|---|---|---|---|---|---|---|
1.843 ± 0.62 | 0.922 ± 0.554 |
3.226 ± 0.686 | 5.991 ± 1.758 |
3.687 ± 1.472 | 4.147 ± 1.703 |
4.147 ± 1.19 | 13.364 ± 2.09 |
8.756 ± 3.357 | 8.756 ± 3.217 |
Met |
Asn |
Gln |
Pro |
Arg |
Ser |
Thr |
Val |
Trp |
Tyr |
|---|---|---|---|---|---|---|---|---|---|
4.147 ± 0.892 | 7.834 ± 1.745 |
2.765 ± 0.496 | 1.382 ± 0.988 |
5.991 ± 3.14 | 5.069 ± 1.775 |
5.991 ± 0.932 | 4.608 ± 0.868 |
0.922 ± 0.463 | 6.452 ± 1.695 |
Most of the basic statistics you can see at this page can be downloaded from this CSV file
See this proteome in:

Proteome-pI is available under Creative Commons Attribution-NoDerivs license, for more details see here
| Reference: Kozlowski LP. Proteome-pI 2.0: Proteome Isoelectric Point Database Update. Nucleic Acids Res. 2021, doi: 10.1093/nar/gkab944 | Contact: Lukasz P. Kozlowski |