Microviridae sp. ctOsc38
Taxonomy: Viruses; Monodnaviria; Sangervirae; Phixviricota; Malgrandaviricetes; Petitvirales; Microviridae; unclassified Microviridae
Average proteome isoelectric point is 7.46
Get precalculated fractions of proteins
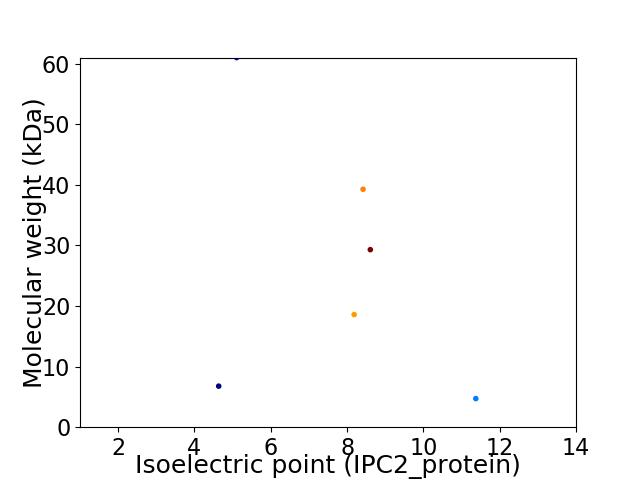
Virtual 2D-PAGE plot for 6 proteins (isoelectric point calculated using IPC2_protein)
Get csv file with sequences according to given criteria:
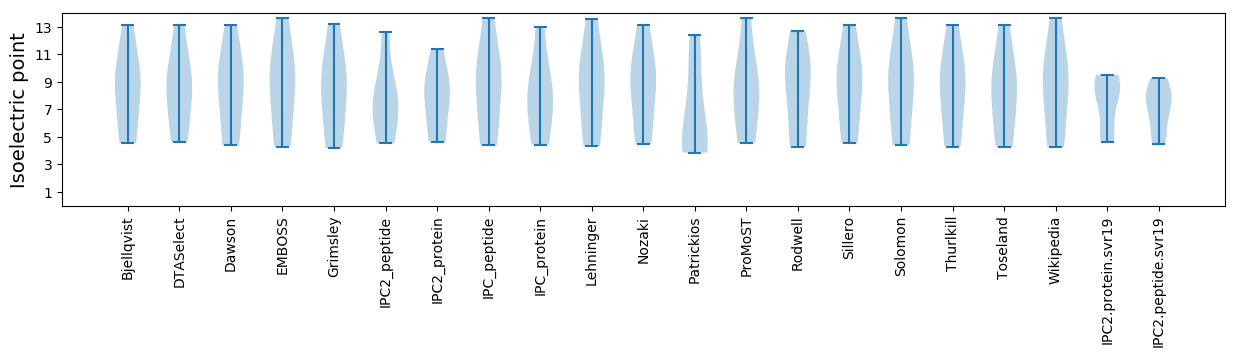
* You can choose from 21 different methods for calculating isoelectric point
Summary statistics related to proteome-wise predictions
Protein with the lowest isoelectric point:
>tr|A0A5Q2WAR3|A0A5Q2WAR3_9VIRU Major capsid protein OS=Microviridae sp. ctOsc38 OX=2656698 PE=3 SV=1
MM1 pKa = 7.39VNDD4 pKa = 4.52PEE6 pKa = 4.66TVPSKK11 pKa = 10.96YY12 pKa = 9.89PADD15 pKa = 3.63FRR17 pKa = 11.84LVEE20 pKa = 4.34LGEE23 pKa = 4.09WDD25 pKa = 3.88TTTGIYY31 pKa = 10.06SEE33 pKa = 4.59NEE35 pKa = 3.69VPKK38 pKa = 10.87ALGSALDD45 pKa = 3.79YY46 pKa = 10.77KK47 pKa = 10.66RR48 pKa = 11.84RR49 pKa = 11.84PQDD52 pKa = 3.54EE53 pKa = 4.91LPLKK57 pKa = 10.47AVQQ60 pKa = 3.47
MM1 pKa = 7.39VNDD4 pKa = 4.52PEE6 pKa = 4.66TVPSKK11 pKa = 10.96YY12 pKa = 9.89PADD15 pKa = 3.63FRR17 pKa = 11.84LVEE20 pKa = 4.34LGEE23 pKa = 4.09WDD25 pKa = 3.88TTTGIYY31 pKa = 10.06SEE33 pKa = 4.59NEE35 pKa = 3.69VPKK38 pKa = 10.87ALGSALDD45 pKa = 3.79YY46 pKa = 10.77KK47 pKa = 10.66RR48 pKa = 11.84RR49 pKa = 11.84PQDD52 pKa = 3.54EE53 pKa = 4.91LPLKK57 pKa = 10.47AVQQ60 pKa = 3.47
Molecular weight: 6.78 kDa
Isoelectric point according different methods:
Protein with the highest isoelectric point:
>tr|A0A5Q2WBY3|A0A5Q2WBY3_9VIRU Uncharacterized protein OS=Microviridae sp. ctOsc38 OX=2656698 PE=4 SV=1
MM1 pKa = 7.74RR2 pKa = 11.84GRR4 pKa = 11.84RR5 pKa = 11.84RR6 pKa = 11.84MSKK9 pKa = 9.51RR10 pKa = 11.84RR11 pKa = 11.84SRR13 pKa = 11.84RR14 pKa = 11.84LFTRR18 pKa = 11.84TAKK21 pKa = 10.04RR22 pKa = 11.84VHH24 pKa = 6.13RR25 pKa = 11.84RR26 pKa = 11.84NGGGRR31 pKa = 11.84VMRR34 pKa = 11.84GGVRR38 pKa = 11.84LL39 pKa = 3.57
MM1 pKa = 7.74RR2 pKa = 11.84GRR4 pKa = 11.84RR5 pKa = 11.84RR6 pKa = 11.84MSKK9 pKa = 9.51RR10 pKa = 11.84RR11 pKa = 11.84SRR13 pKa = 11.84RR14 pKa = 11.84LFTRR18 pKa = 11.84TAKK21 pKa = 10.04RR22 pKa = 11.84VHH24 pKa = 6.13RR25 pKa = 11.84RR26 pKa = 11.84NGGGRR31 pKa = 11.84VMRR34 pKa = 11.84GGVRR38 pKa = 11.84LL39 pKa = 3.57
Molecular weight: 4.72 kDa
Isoelectric point according different methods:
Peptides (in silico digests for buttom-up proteomics)
Below you can find in silico digests of the whole proteome with Trypsin, Chymotrypsin, Trypsin+LysC, LysN, ArgC proteases suitable for different mass spec machines.| Try ESI |
 |
|---|
| ChTry ESI |
|
|---|
| ArgC ESI |
|
|---|
| LysN ESI |
|
|---|
| TryLysC ESI |
|
|---|
| Try MALDI |
|
|---|
| ChTry MALDI |
|
|---|
| ArgC MALDI |
|
|---|
| LysN MALDI |
|
|---|
| TryLysC MALDI |
|
|---|
| Try LTQ |
|
|---|
| ChTry LTQ |
|
|---|
| ArgC LTQ |
|
|---|
| LysN LTQ |
|
|---|
| TryLysC LTQ |
|
|---|
| Try MSlow |
|
|---|
| ChTry MSlow |
|
|---|
| ArgC MSlow |
|
|---|
| LysN MSlow |
|
|---|
| TryLysC MSlow |
|
|---|
| Try MShigh |
|
|---|
| ChTry MShigh |
|
|---|
| ArgC MShigh |
|
|---|
| LysN MShigh |
|
|---|
| TryLysC MShigh |
|
|---|
General Statistics
Number of major isoforms |
Number of additional isoforms |
Number of all proteins |
Number of amino acids |
Min. Seq. Length |
Max. Seq. Length |
Avg. Seq. Length |
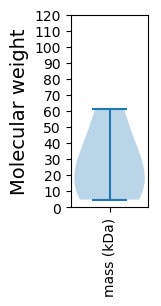
Avg. Mol. Weight |
|---|---|---|---|---|---|---|---|
0 |
1448 |
39 |
554 |
241.3 |
26.62 |
Amino acid frequency
Ala |
Cys |
Asp |
Glu |
Phe |
Gly |
His |
Ile |
Lys |
Leu |
|---|---|---|---|---|---|---|---|---|---|
11.671 ± 1.954 | 0.967 ± 0.458 |
5.663 ± 0.705 | 5.87 ± 1.518 |
4.489 ± 0.719 | 9.323 ± 0.98 |
2.003 ± 0.566 | 2.97 ± 0.571 |
4.42 ± 1.169 | 7.251 ± 0.467 |
Met |
Asn |
Gln |
Pro |
Arg |
Ser |
Thr |
Val |
Trp |
Tyr |
|---|---|---|---|---|---|---|---|---|---|
2.417 ± 0.602 | 3.729 ± 0.519 |
5.594 ± 0.694 | 3.729 ± 0.67 |
8.287 ± 1.931 | 5.594 ± 0.699 |
5.525 ± 1.041 | 5.594 ± 0.69 |
1.45 ± 0.409 | 3.453 ± 0.863 |
Most of the basic statistics you can see at this page can be downloaded from this CSV file
See this proteome in:

Proteome-pI is available under Creative Commons Attribution-NoDerivs license, for more details see here
| Reference: Kozlowski LP. Proteome-pI 2.0: Proteome Isoelectric Point Database Update. Nucleic Acids Res. 2021, doi: 10.1093/nar/gkab944 | Contact: Lukasz P. Kozlowski |