Escherichia phage vB_EcoP_PhAPEC5
Taxonomy: Viruses; Duplodnaviria; Heunggongvirae; Uroviricota; Caudoviricetes; Caudovirales; Schitoviridae; Enquatrovirinae; Gamaleyavirus; Escherichia virus APEC5
Average proteome isoelectric point is 6.39
Get precalculated fractions of proteins
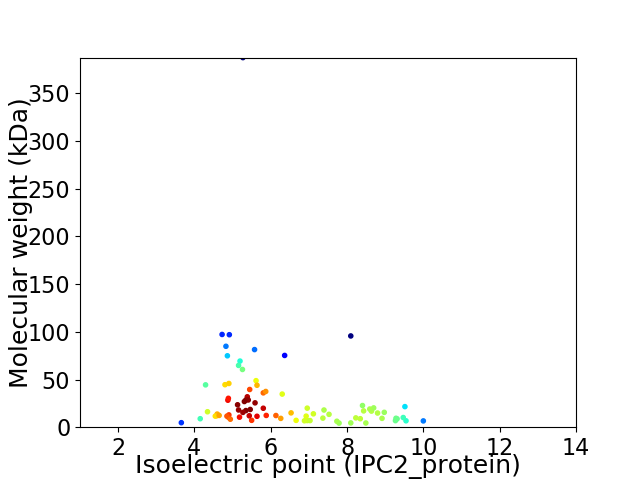
Virtual 2D-PAGE plot for 83 proteins (isoelectric point calculated using IPC2_protein)
Get csv file with sequences according to given criteria:
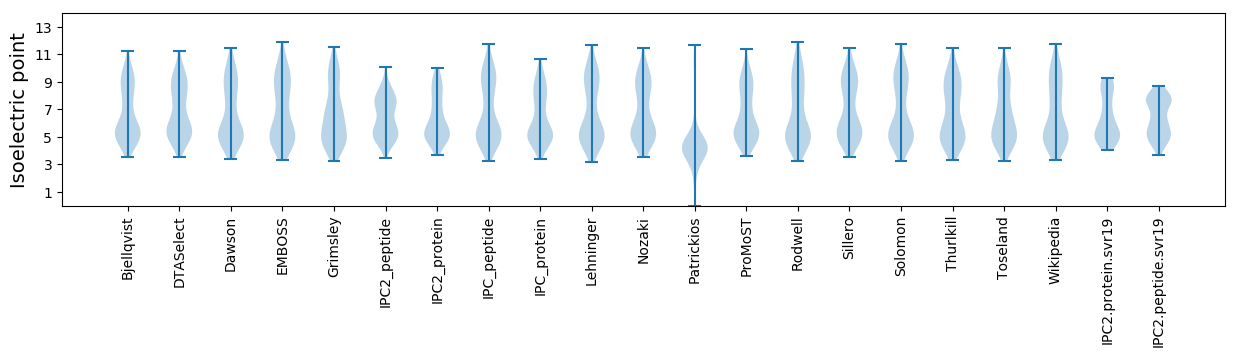
* You can choose from 21 different methods for calculating isoelectric point
Summary statistics related to proteome-wise predictions
Protein with the lowest isoelectric point:
>tr|A0A067Y147|A0A067Y147_9CAUD RIIA-like protein OS=Escherichia phage vB_EcoP_PhAPEC5 OX=1395983 GN=PhAPEC5_34 PE=4 SV=1
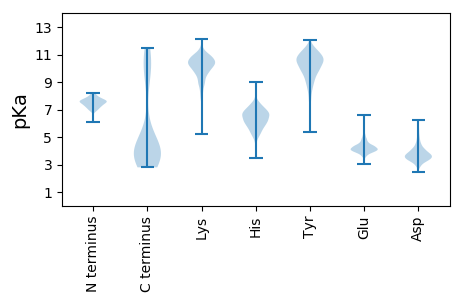
MM1 pKa = 6.92SQEE4 pKa = 3.83DD5 pKa = 3.77ALFIIRR11 pKa = 11.84NFLDD15 pKa = 3.97ANWEE19 pKa = 4.08QFSEE23 pKa = 4.73FCEE26 pKa = 4.12EE27 pKa = 4.06LGEE30 pKa = 4.47SAEE33 pKa = 4.19EE34 pKa = 4.36TYY36 pKa = 10.84EE37 pKa = 4.04ATSGG41 pKa = 3.41
MM1 pKa = 6.92SQEE4 pKa = 3.83DD5 pKa = 3.77ALFIIRR11 pKa = 11.84NFLDD15 pKa = 3.97ANWEE19 pKa = 4.08QFSEE23 pKa = 4.73FCEE26 pKa = 4.12EE27 pKa = 4.06LGEE30 pKa = 4.47SAEE33 pKa = 4.19EE34 pKa = 4.36TYY36 pKa = 10.84EE37 pKa = 4.04ATSGG41 pKa = 3.41
Molecular weight: 4.74 kDa
Isoelectric point according different methods:
Protein with the highest isoelectric point:
>tr|A0A067Y083|A0A067Y083_9CAUD Uncharacterized protein OS=Escherichia phage vB_EcoP_PhAPEC5 OX=1395983 GN=PhAPEC5_10 PE=4 SV=1
MM1 pKa = 7.67RR2 pKa = 11.84KK3 pKa = 9.51SLIMGTKK10 pKa = 9.64EE11 pKa = 3.63DD12 pKa = 3.52VSRR15 pKa = 11.84LRR17 pKa = 11.84NRR19 pKa = 11.84NVASKK24 pKa = 9.46RR25 pKa = 11.84TLSMTNEE32 pKa = 3.84QLQEE36 pKa = 4.45FIDD39 pKa = 4.23AGLKK43 pKa = 8.89QSKK46 pKa = 10.23ARR48 pKa = 11.84IVTYY52 pKa = 9.03NHH54 pKa = 6.82PCIKK58 pKa = 10.55
MM1 pKa = 7.67RR2 pKa = 11.84KK3 pKa = 9.51SLIMGTKK10 pKa = 9.64EE11 pKa = 3.63DD12 pKa = 3.52VSRR15 pKa = 11.84LRR17 pKa = 11.84NRR19 pKa = 11.84NVASKK24 pKa = 9.46RR25 pKa = 11.84TLSMTNEE32 pKa = 3.84QLQEE36 pKa = 4.45FIDD39 pKa = 4.23AGLKK43 pKa = 8.89QSKK46 pKa = 10.23ARR48 pKa = 11.84IVTYY52 pKa = 9.03NHH54 pKa = 6.82PCIKK58 pKa = 10.55
Molecular weight: 6.71 kDa
Isoelectric point according different methods:
Peptides (in silico digests for buttom-up proteomics)
Below you can find in silico digests of the whole proteome with Trypsin, Chymotrypsin, Trypsin+LysC, LysN, ArgC proteases suitable for different mass spec machines.| Try ESI |
 |
|---|
| ChTry ESI |
|
|---|
| ArgC ESI |
|
|---|
| LysN ESI |
|
|---|
| TryLysC ESI |
|
|---|
| Try MALDI |
|
|---|
| ChTry MALDI |
|
|---|
| ArgC MALDI |
|
|---|
| LysN MALDI |
|
|---|
| TryLysC MALDI |
|
|---|
| Try LTQ |
|
|---|
| ChTry LTQ |
|
|---|
| ArgC LTQ |
|
|---|
| LysN LTQ |
|
|---|
| TryLysC LTQ |
|
|---|
| Try MSlow |
|
|---|
| ChTry MSlow |
|
|---|
| ArgC MSlow |
|
|---|
| LysN MSlow |
|
|---|
| TryLysC MSlow |
|
|---|
| Try MShigh |
|
|---|
| ChTry MShigh |
|
|---|
| ArgC MShigh |
|
|---|
| LysN MShigh |
|
|---|
| TryLysC MShigh |
|
|---|
General Statistics
Number of major isoforms |
Number of additional isoforms |
Number of all proteins |
Number of amino acids |
Min. Seq. Length |
Max. Seq. Length |
Avg. Seq. Length |
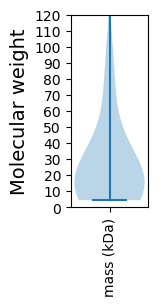
Avg. Mol. Weight |
|---|---|---|---|---|---|---|---|
0 |
22016 |
39 |
3571 |
265.3 |
29.49 |
Amino acid frequency
Ala |
Cys |
Asp |
Glu |
Phe |
Gly |
His |
Ile |
Lys |
Leu |
|---|---|---|---|---|---|---|---|---|---|
8.78 ± 0.592 | 0.922 ± 0.178 |
5.759 ± 0.14 | 6.414 ± 0.277 |
3.702 ± 0.177 | 6.781 ± 0.247 |
1.699 ± 0.158 | 5.682 ± 0.279 |
6.314 ± 0.291 | 8.23 ± 0.191 |
Met |
Asn |
Gln |
Pro |
Arg |
Ser |
Thr |
Val |
Trp |
Tyr |
|---|---|---|---|---|---|---|---|---|---|
2.989 ± 0.15 | 5.841 ± 0.201 |
3.988 ± 0.157 | 4.374 ± 0.292 |
4.242 ± 0.139 | 6.245 ± 0.24 |
6.368 ± 0.265 | 6.786 ± 0.222 |
1.204 ± 0.128 | 3.679 ± 0.266 |
Most of the basic statistics you can see at this page can be downloaded from this CSV file
See this proteome in:

Proteome-pI is available under Creative Commons Attribution-NoDerivs license, for more details see here
| Reference: Kozlowski LP. Proteome-pI 2.0: Proteome Isoelectric Point Database Update. Nucleic Acids Res. 2021, doi: 10.1093/nar/gkab944 | Contact: Lukasz P. Kozlowski |