Betaproteobacteria bacterium SCN2
Taxonomy: cellular organisms; Bacteria; Proteobacteria; Betaproteobacteria; unclassified Betaproteobacteria
Average proteome isoelectric point is 6.68
Get precalculated fractions of proteins
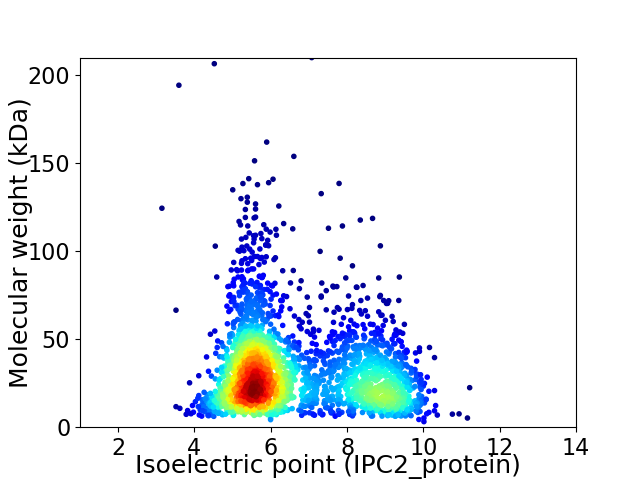
Virtual 2D-PAGE plot for 2629 proteins (isoelectric point calculated using IPC2_protein)
Get csv file with sequences according to given criteria:
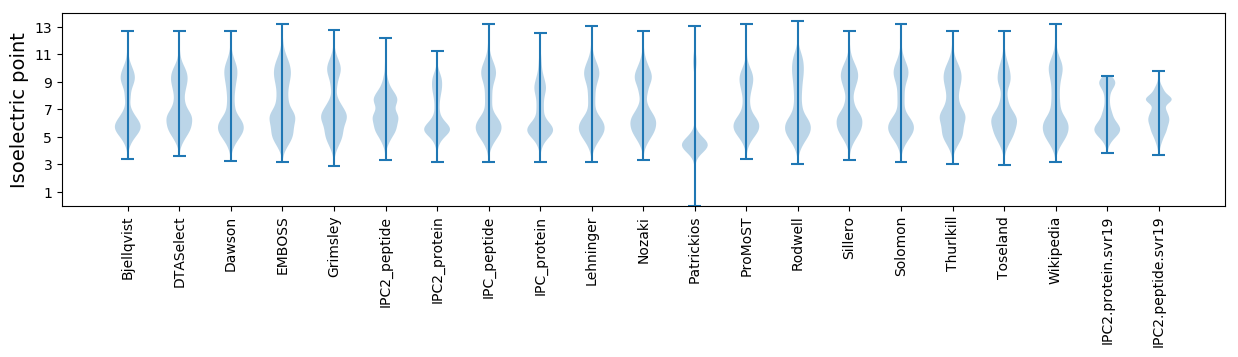
* You can choose from 21 different methods for calculating isoelectric point
Summary statistics related to proteome-wise predictions

Protein with the lowest isoelectric point:
>tr|A0A6H9Y8K1|A0A6H9Y8K1_9PROT C-type cytochrome OS=Betaproteobacteria bacterium SCN2 OX=2651628 GN=F8A87_00185 PE=4 SV=1
MM1 pKa = 7.83SDD3 pKa = 3.0TPEE6 pKa = 4.11YY7 pKa = 8.7KK8 pKa = 9.19TWMCLLCGFIYY19 pKa = 10.51DD20 pKa = 4.65EE21 pKa = 4.44EE22 pKa = 5.07KK23 pKa = 10.69GWPQDD28 pKa = 3.53GIAPGTRR35 pKa = 11.84WEE37 pKa = 4.3DD38 pKa = 3.35VPMNWTCPDD47 pKa = 3.26CGGRR51 pKa = 11.84KK52 pKa = 8.92EE53 pKa = 4.37DD54 pKa = 3.97FEE56 pKa = 4.79MIAVV60 pKa = 4.03
MM1 pKa = 7.83SDD3 pKa = 3.0TPEE6 pKa = 4.11YY7 pKa = 8.7KK8 pKa = 9.19TWMCLLCGFIYY19 pKa = 10.51DD20 pKa = 4.65EE21 pKa = 4.44EE22 pKa = 5.07KK23 pKa = 10.69GWPQDD28 pKa = 3.53GIAPGTRR35 pKa = 11.84WEE37 pKa = 4.3DD38 pKa = 3.35VPMNWTCPDD47 pKa = 3.26CGGRR51 pKa = 11.84KK52 pKa = 8.92EE53 pKa = 4.37DD54 pKa = 3.97FEE56 pKa = 4.79MIAVV60 pKa = 4.03
Molecular weight: 6.95 kDa
Isoelectric point according different methods:
Protein with the highest isoelectric point:
>tr|A0A6H9Y1Q2|A0A6H9Y1Q2_9PROT TolC family protein OS=Betaproteobacteria bacterium SCN2 OX=2651628 GN=F8A87_10605 PE=3 SV=1
MM1 pKa = 7.35KK2 pKa = 9.36RR3 pKa = 11.84TYY5 pKa = 10.06QPSVTRR11 pKa = 11.84RR12 pKa = 11.84KK13 pKa = 8.0RR14 pKa = 11.84THH16 pKa = 5.76GFRR19 pKa = 11.84VRR21 pKa = 11.84MKK23 pKa = 9.39TRR25 pKa = 11.84GGRR28 pKa = 11.84AVINARR34 pKa = 11.84RR35 pKa = 11.84AKK37 pKa = 9.86GRR39 pKa = 11.84HH40 pKa = 4.92RR41 pKa = 11.84LAVV44 pKa = 3.37
MM1 pKa = 7.35KK2 pKa = 9.36RR3 pKa = 11.84TYY5 pKa = 10.06QPSVTRR11 pKa = 11.84RR12 pKa = 11.84KK13 pKa = 8.0RR14 pKa = 11.84THH16 pKa = 5.76GFRR19 pKa = 11.84VRR21 pKa = 11.84MKK23 pKa = 9.39TRR25 pKa = 11.84GGRR28 pKa = 11.84AVINARR34 pKa = 11.84RR35 pKa = 11.84AKK37 pKa = 9.86GRR39 pKa = 11.84HH40 pKa = 4.92RR41 pKa = 11.84LAVV44 pKa = 3.37
Molecular weight: 5.22 kDa
Isoelectric point according different methods:
Peptides (in silico digests for buttom-up proteomics)
Below you can find in silico digests of the whole proteome with Trypsin, Chymotrypsin, Trypsin+LysC, LysN, ArgC proteases suitable for different mass spec machines.| Try ESI |
 |
|---|
| ChTry ESI |
|
|---|
| ArgC ESI |
|
|---|
| LysN ESI |
|
|---|
| TryLysC ESI |
|
|---|
| Try MALDI |
|
|---|
| ChTry MALDI |
|
|---|
| ArgC MALDI |
|
|---|
| LysN MALDI |
|
|---|
| TryLysC MALDI |
|
|---|
| Try LTQ |
|
|---|
| ChTry LTQ |
|
|---|
| ArgC LTQ |
|
|---|
| LysN LTQ |
|
|---|
| TryLysC LTQ |
|
|---|
| Try MSlow |
|
|---|
| ChTry MSlow |
|
|---|
| ArgC MSlow |
|
|---|
| LysN MSlow |
|
|---|
| TryLysC MSlow |
|
|---|
| Try MShigh |
|
|---|
| ChTry MShigh |
|
|---|
| ArgC MShigh |
|
|---|
| LysN MShigh |
|
|---|
| TryLysC MShigh |
|
|---|
General Statistics
Number of major isoforms |
Number of additional isoforms |
Number of all proteins |
Number of amino acids |
Min. Seq. Length |
Max. Seq. Length |
Avg. Seq. Length |
Avg. Mol. Weight |
|---|---|---|---|---|---|---|---|
0 |
806251 |
32 |
1917 |
306.7 |
33.66 |
Amino acid frequency
Ala |
Cys |
Asp |
Glu |
Phe |
Gly |
His |
Ile |
Lys |
Leu |
|---|---|---|---|---|---|---|---|---|---|
11.82 ± 0.071 | 0.933 ± 0.016 |
5.354 ± 0.039 | 6.224 ± 0.049 |
3.644 ± 0.031 | 7.996 ± 0.045 |
2.379 ± 0.024 | 4.883 ± 0.033 |
3.955 ± 0.042 | 11.002 ± 0.069 |
Met |
Asn |
Gln |
Pro |
Arg |
Ser |
Thr |
Val |
Trp |
Tyr |
|---|---|---|---|---|---|---|---|---|---|
2.586 ± 0.025 | 2.814 ± 0.027 |
4.949 ± 0.033 | 3.721 ± 0.029 |
6.901 ± 0.047 | 5.215 ± 0.031 |
4.621 ± 0.03 | 7.089 ± 0.036 |
1.416 ± 0.023 | 2.501 ± 0.024 |
Most of the basic statistics you can see at this page can be downloaded from this CSV file
See this proteome in:

Proteome-pI is available under Creative Commons Attribution-NoDerivs license, for more details see here
| Reference: Kozlowski LP. Proteome-pI 2.0: Proteome Isoelectric Point Database Update. Nucleic Acids Res. 2021, doi: 10.1093/nar/gkab944 | Contact: Lukasz P. Kozlowski |