Acinetobacter larvae
Taxonomy: cellular organisms; Bacteria; Proteobacteria; Gammaproteobacteria; Pseudomonadales; Moraxellaceae; Acinetobacter
Average proteome isoelectric point is 6.58
Get precalculated fractions of proteins
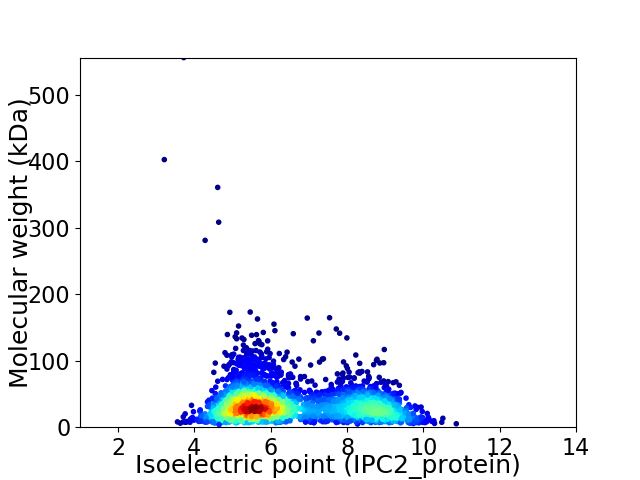
Virtual 2D-PAGE plot for 3108 proteins (isoelectric point calculated using IPC2_protein)
Get csv file with sequences according to given criteria:
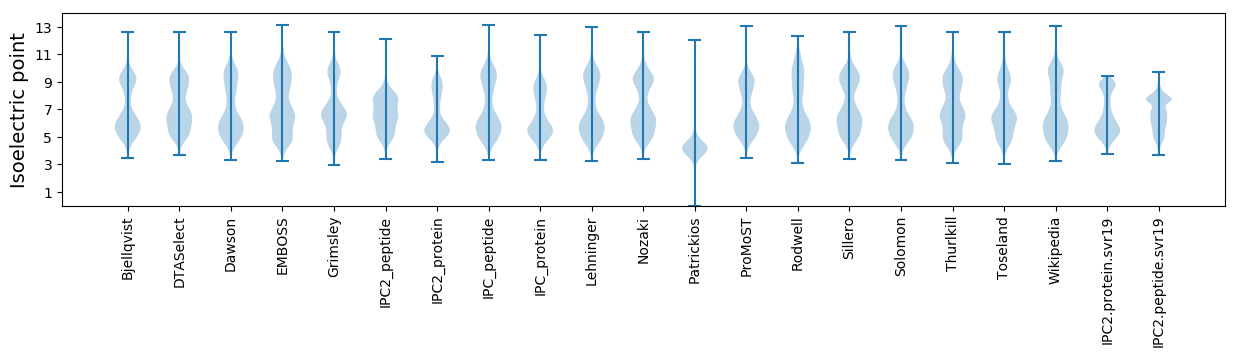
* You can choose from 21 different methods for calculating isoelectric point
Summary statistics related to proteome-wise predictions
Protein with the lowest isoelectric point:
>tr|A0A1B2M2T1|A0A1B2M2T1_9GAMM RNA pyrophosphohydrolase OS=Acinetobacter larvae OX=1789224 GN=rppH PE=3 SV=1
MM1 pKa = 7.74LFDD4 pKa = 4.49LFKK7 pKa = 11.12NSSLSKK13 pKa = 8.19YY14 pKa = 9.91IEE16 pKa = 4.18YY17 pKa = 10.45AVCDD21 pKa = 4.36DD22 pKa = 4.39DD23 pKa = 4.38CLEE26 pKa = 4.1VFFIDD31 pKa = 4.26SDD33 pKa = 3.89EE34 pKa = 6.13LFILWNSNLDD44 pKa = 3.27INYY47 pKa = 8.19ATIISNNIRR56 pKa = 11.84LPSLIIFF63 pKa = 4.68
MM1 pKa = 7.74LFDD4 pKa = 4.49LFKK7 pKa = 11.12NSSLSKK13 pKa = 8.19YY14 pKa = 9.91IEE16 pKa = 4.18YY17 pKa = 10.45AVCDD21 pKa = 4.36DD22 pKa = 4.39DD23 pKa = 4.38CLEE26 pKa = 4.1VFFIDD31 pKa = 4.26SDD33 pKa = 3.89EE34 pKa = 6.13LFILWNSNLDD44 pKa = 3.27INYY47 pKa = 8.19ATIISNNIRR56 pKa = 11.84LPSLIIFF63 pKa = 4.68
Molecular weight: 7.39 kDa
Isoelectric point according different methods:
Protein with the highest isoelectric point:
>tr|A0A1B2M3R2|A0A1B2M3R2_9GAMM Transposase OS=Acinetobacter larvae OX=1789224 GN=BFG52_03195 PE=4 SV=1
MM1 pKa = 7.45KK2 pKa = 9.55RR3 pKa = 11.84TFQPSEE9 pKa = 3.97LKK11 pKa = 10.13RR12 pKa = 11.84KK13 pKa = 8.98RR14 pKa = 11.84VHH16 pKa = 6.36GFRR19 pKa = 11.84ARR21 pKa = 11.84MATKK25 pKa = 10.4AGRR28 pKa = 11.84QVLARR33 pKa = 11.84RR34 pKa = 11.84RR35 pKa = 11.84AKK37 pKa = 10.18GRR39 pKa = 11.84HH40 pKa = 5.1SLTVV44 pKa = 3.06
MM1 pKa = 7.45KK2 pKa = 9.55RR3 pKa = 11.84TFQPSEE9 pKa = 3.97LKK11 pKa = 10.13RR12 pKa = 11.84KK13 pKa = 8.98RR14 pKa = 11.84VHH16 pKa = 6.36GFRR19 pKa = 11.84ARR21 pKa = 11.84MATKK25 pKa = 10.4AGRR28 pKa = 11.84QVLARR33 pKa = 11.84RR34 pKa = 11.84RR35 pKa = 11.84AKK37 pKa = 10.18GRR39 pKa = 11.84HH40 pKa = 5.1SLTVV44 pKa = 3.06
Molecular weight: 5.18 kDa
Isoelectric point according different methods:
Peptides (in silico digests for buttom-up proteomics)
Below you can find in silico digests of the whole proteome with Trypsin, Chymotrypsin, Trypsin+LysC, LysN, ArgC proteases suitable for different mass spec machines.| Try ESI |
 |
|---|
| ChTry ESI |
|
|---|
| ArgC ESI |
|
|---|
| LysN ESI |
|
|---|
| TryLysC ESI |
|
|---|
| Try MALDI |
|
|---|
| ChTry MALDI |
|
|---|
| ArgC MALDI |
|
|---|
| LysN MALDI |
|
|---|
| TryLysC MALDI |
|
|---|
| Try LTQ |
|
|---|
| ChTry LTQ |
|
|---|
| ArgC LTQ |
|
|---|
| LysN LTQ |
|
|---|
| TryLysC LTQ |
|
|---|
| Try MSlow |
|
|---|
| ChTry MSlow |
|
|---|
| ArgC MSlow |
|
|---|
| LysN MSlow |
|
|---|
| TryLysC MSlow |
|
|---|
| Try MShigh |
|
|---|
| ChTry MShigh |
|
|---|
| ArgC MShigh |
|
|---|
| LysN MShigh |
|
|---|
| TryLysC MShigh |
|
|---|
General Statistics
Number of major isoforms |
Number of additional isoforms |
Number of all proteins |
Number of amino acids |
Min. Seq. Length |
Max. Seq. Length |
Avg. Seq. Length |
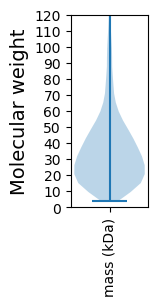
Avg. Mol. Weight |
|---|---|---|---|---|---|---|---|
0 |
1021974 |
33 |
5402 |
328.8 |
36.65 |
Amino acid frequency
Ala |
Cys |
Asp |
Glu |
Phe |
Gly |
His |
Ile |
Lys |
Leu |
|---|---|---|---|---|---|---|---|---|---|
9.694 ± 0.047 | 1.002 ± 0.016 |
5.251 ± 0.047 | 5.069 ± 0.041 |
4.013 ± 0.031 | 6.309 ± 0.069 |
2.621 ± 0.028 | 6.729 ± 0.042 |
4.87 ± 0.047 | 10.679 ± 0.077 |
Met |
Asn |
Gln |
Pro |
Arg |
Ser |
Thr |
Val |
Trp |
Tyr |
|---|---|---|---|---|---|---|---|---|---|
2.349 ± 0.022 | 4.178 ± 0.045 |
3.883 ± 0.037 | 6.536 ± 0.079 |
4.536 ± 0.043 | 6.152 ± 0.036 |
5.008 ± 0.06 | 6.385 ± 0.052 |
1.301 ± 0.021 | 3.433 ± 0.028 |
Most of the basic statistics you can see at this page can be downloaded from this CSV file
See this proteome in:

Proteome-pI is available under Creative Commons Attribution-NoDerivs license, for more details see here
| Reference: Kozlowski LP. Proteome-pI 2.0: Proteome Isoelectric Point Database Update. Nucleic Acids Res. 2021, doi: 10.1093/nar/gkab944 | Contact: Lukasz P. Kozlowski |