Rhodobacteraceae bacterium 63075
Taxonomy: cellular organisms; Bacteria; Proteobacteria; Alphaproteobacteria; Rhodobacterales; Rhodobacteraceae; unclassified Rhodobacteraceae
Average proteome isoelectric point is 6.05
Get precalculated fractions of proteins
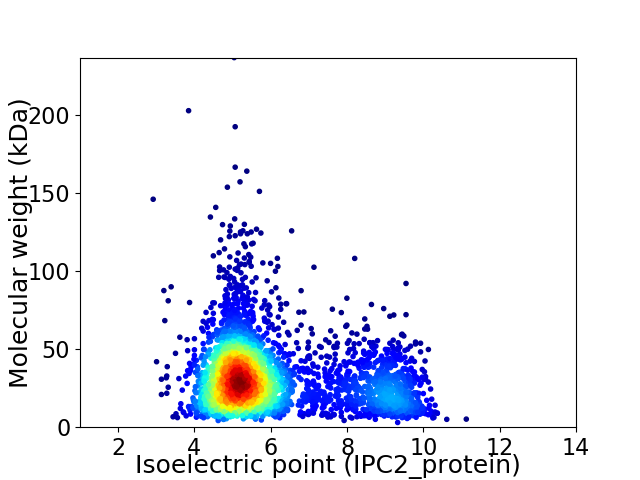
Virtual 2D-PAGE plot for 3352 proteins (isoelectric point calculated using IPC2_protein)
Get csv file with sequences according to given criteria:
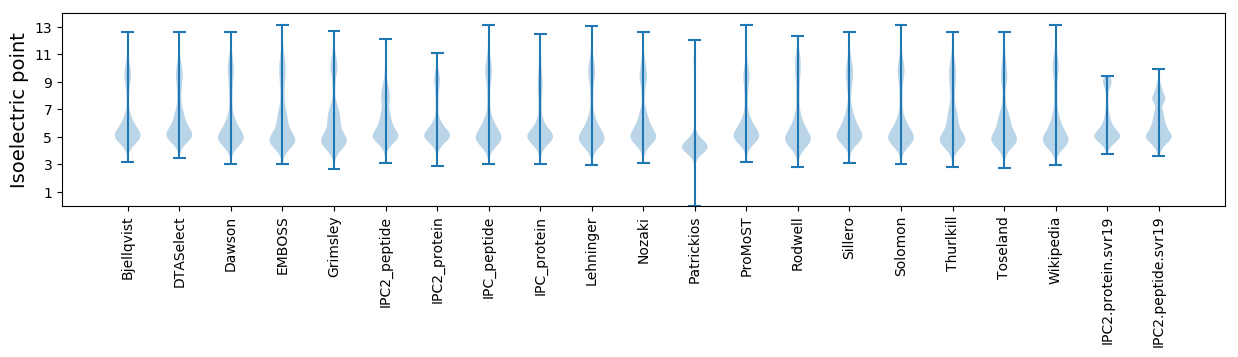
* You can choose from 21 different methods for calculating isoelectric point
Summary statistics related to proteome-wise predictions
Protein with the lowest isoelectric point:
>tr|A0A372EY18|A0A372EY18_9RHOB ABC transporter ATP-binding protein OS=Rhodobacteraceae bacterium 63075 OX=2301226 GN=DZK27_03595 PE=4 SV=1
MM1 pKa = 7.93RR2 pKa = 11.84RR3 pKa = 11.84FTPALALVGLLAACGGDD20 pKa = 3.36GTNPFDD26 pKa = 6.24DD27 pKa = 4.39GTTGDD32 pKa = 4.22TGDD35 pKa = 4.11SEE37 pKa = 5.46IPDD40 pKa = 3.92SLAGDD45 pKa = 4.19LQSFSYY51 pKa = 11.04DD52 pKa = 3.28ADD54 pKa = 3.79NQTLTVTGITQDD66 pKa = 3.27SSPISATYY74 pKa = 8.62TRR76 pKa = 11.84NPALDD81 pKa = 3.5TAGYY85 pKa = 8.24EE86 pKa = 4.21AYY88 pKa = 10.49SIQDD92 pKa = 3.55DD93 pKa = 3.98ALSRR97 pKa = 11.84HH98 pKa = 6.36AIALVRR104 pKa = 11.84EE105 pKa = 4.49SGNSGSVRR113 pKa = 11.84AGVVSTGGQFNRR125 pKa = 11.84IHH127 pKa = 6.38HH128 pKa = 6.14GGYY131 pKa = 8.84YY132 pKa = 9.53EE133 pKa = 4.58RR134 pKa = 11.84SGSYY138 pKa = 7.58TQPTTGTARR147 pKa = 11.84YY148 pKa = 8.67AGTYY152 pKa = 10.36AGLTNVQVSGDD163 pKa = 4.16LVPPGPGTPPEE174 pKa = 4.21VLPGQAARR182 pKa = 11.84TEE184 pKa = 4.38GNVLINADD192 pKa = 3.97FNDD195 pKa = 4.08GSIEE199 pKa = 3.78GTIYY203 pKa = 10.75DD204 pKa = 4.38RR205 pKa = 11.84EE206 pKa = 4.23IVDD209 pKa = 3.93TGDD212 pKa = 3.51TLPSIVLVTGEE223 pKa = 4.22IADD226 pKa = 4.36DD227 pKa = 3.8GTFFGEE233 pKa = 4.09EE234 pKa = 3.77VEE236 pKa = 4.38YY237 pKa = 11.25DD238 pKa = 3.36GDD240 pKa = 3.73VDD242 pKa = 5.48NDD244 pKa = 3.11IGDD247 pKa = 3.53YY248 pKa = 11.08GGIFGGPDD256 pKa = 3.21AEE258 pKa = 4.51SVGGVVNLDD267 pKa = 3.56EE268 pKa = 6.02FDD270 pKa = 5.39DD271 pKa = 3.92NTLGFEE277 pKa = 4.6GEE279 pKa = 4.31VEE281 pKa = 4.02TGVFVLEE288 pKa = 4.57SCDD291 pKa = 3.76SADD294 pKa = 3.55ATSPLCPP301 pKa = 4.05
MM1 pKa = 7.93RR2 pKa = 11.84RR3 pKa = 11.84FTPALALVGLLAACGGDD20 pKa = 3.36GTNPFDD26 pKa = 6.24DD27 pKa = 4.39GTTGDD32 pKa = 4.22TGDD35 pKa = 4.11SEE37 pKa = 5.46IPDD40 pKa = 3.92SLAGDD45 pKa = 4.19LQSFSYY51 pKa = 11.04DD52 pKa = 3.28ADD54 pKa = 3.79NQTLTVTGITQDD66 pKa = 3.27SSPISATYY74 pKa = 8.62TRR76 pKa = 11.84NPALDD81 pKa = 3.5TAGYY85 pKa = 8.24EE86 pKa = 4.21AYY88 pKa = 10.49SIQDD92 pKa = 3.55DD93 pKa = 3.98ALSRR97 pKa = 11.84HH98 pKa = 6.36AIALVRR104 pKa = 11.84EE105 pKa = 4.49SGNSGSVRR113 pKa = 11.84AGVVSTGGQFNRR125 pKa = 11.84IHH127 pKa = 6.38HH128 pKa = 6.14GGYY131 pKa = 8.84YY132 pKa = 9.53EE133 pKa = 4.58RR134 pKa = 11.84SGSYY138 pKa = 7.58TQPTTGTARR147 pKa = 11.84YY148 pKa = 8.67AGTYY152 pKa = 10.36AGLTNVQVSGDD163 pKa = 4.16LVPPGPGTPPEE174 pKa = 4.21VLPGQAARR182 pKa = 11.84TEE184 pKa = 4.38GNVLINADD192 pKa = 3.97FNDD195 pKa = 4.08GSIEE199 pKa = 3.78GTIYY203 pKa = 10.75DD204 pKa = 4.38RR205 pKa = 11.84EE206 pKa = 4.23IVDD209 pKa = 3.93TGDD212 pKa = 3.51TLPSIVLVTGEE223 pKa = 4.22IADD226 pKa = 4.36DD227 pKa = 3.8GTFFGEE233 pKa = 4.09EE234 pKa = 3.77VEE236 pKa = 4.38YY237 pKa = 11.25DD238 pKa = 3.36GDD240 pKa = 3.73VDD242 pKa = 5.48NDD244 pKa = 3.11IGDD247 pKa = 3.53YY248 pKa = 11.08GGIFGGPDD256 pKa = 3.21AEE258 pKa = 4.51SVGGVVNLDD267 pKa = 3.56EE268 pKa = 6.02FDD270 pKa = 5.39DD271 pKa = 3.92NTLGFEE277 pKa = 4.6GEE279 pKa = 4.31VEE281 pKa = 4.02TGVFVLEE288 pKa = 4.57SCDD291 pKa = 3.76SADD294 pKa = 3.55ATSPLCPP301 pKa = 4.05
Molecular weight: 31.16 kDa
Isoelectric point according different methods:
Protein with the highest isoelectric point:
>tr|A0A372EYN5|A0A372EYN5_9RHOB MerR family DNA-binding transcriptional regulator OS=Rhodobacteraceae bacterium 63075 OX=2301226 GN=DZK27_04070 PE=4 SV=1
MM1 pKa = 7.35KK2 pKa = 9.44RR3 pKa = 11.84TYY5 pKa = 10.31QPSNLVRR12 pKa = 11.84KK13 pKa = 9.18RR14 pKa = 11.84RR15 pKa = 11.84HH16 pKa = 4.42GFRR19 pKa = 11.84ARR21 pKa = 11.84MATKK25 pKa = 10.37AGRR28 pKa = 11.84KK29 pKa = 8.41ILNARR34 pKa = 11.84RR35 pKa = 11.84VRR37 pKa = 11.84GRR39 pKa = 11.84KK40 pKa = 9.13SLSAA44 pKa = 3.93
MM1 pKa = 7.35KK2 pKa = 9.44RR3 pKa = 11.84TYY5 pKa = 10.31QPSNLVRR12 pKa = 11.84KK13 pKa = 9.18RR14 pKa = 11.84RR15 pKa = 11.84HH16 pKa = 4.42GFRR19 pKa = 11.84ARR21 pKa = 11.84MATKK25 pKa = 10.37AGRR28 pKa = 11.84KK29 pKa = 8.41ILNARR34 pKa = 11.84RR35 pKa = 11.84VRR37 pKa = 11.84GRR39 pKa = 11.84KK40 pKa = 9.13SLSAA44 pKa = 3.93
Molecular weight: 5.18 kDa
Isoelectric point according different methods:
Peptides (in silico digests for buttom-up proteomics)
Below you can find in silico digests of the whole proteome with Trypsin, Chymotrypsin, Trypsin+LysC, LysN, ArgC proteases suitable for different mass spec machines.| Try ESI |
 |
|---|
| ChTry ESI |
|
|---|
| ArgC ESI |
|
|---|
| LysN ESI |
|
|---|
| TryLysC ESI |
|
|---|
| Try MALDI |
|
|---|
| ChTry MALDI |
|
|---|
| ArgC MALDI |
|
|---|
| LysN MALDI |
|
|---|
| TryLysC MALDI |
|
|---|
| Try LTQ |
|
|---|
| ChTry LTQ |
|
|---|
| ArgC LTQ |
|
|---|
| LysN LTQ |
|
|---|
| TryLysC LTQ |
|
|---|
| Try MSlow |
|
|---|
| ChTry MSlow |
|
|---|
| ArgC MSlow |
|
|---|
| LysN MSlow |
|
|---|
| TryLysC MSlow |
|
|---|
| Try MShigh |
|
|---|
| ChTry MShigh |
|
|---|
| ArgC MShigh |
|
|---|
| LysN MShigh |
|
|---|
| TryLysC MShigh |
|
|---|
General Statistics
Number of major isoforms |
Number of additional isoforms |
Number of all proteins |
Number of amino acids |
Min. Seq. Length |
Max. Seq. Length |
Avg. Seq. Length |
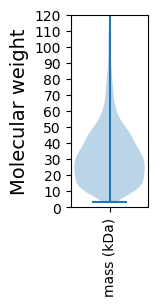
Avg. Mol. Weight |
|---|---|---|---|---|---|---|---|
0 |
1034919 |
29 |
2150 |
308.7 |
33.59 |
Amino acid frequency
Ala |
Cys |
Asp |
Glu |
Phe |
Gly |
His |
Ile |
Lys |
Leu |
|---|---|---|---|---|---|---|---|---|---|
12.33 ± 0.057 | 0.889 ± 0.015 |
5.824 ± 0.036 | 6.889 ± 0.038 |
3.753 ± 0.027 | 8.844 ± 0.047 |
2.095 ± 0.023 | 5.036 ± 0.03 |
3.398 ± 0.035 | 10.031 ± 0.051 |
Met |
Asn |
Gln |
Pro |
Arg |
Ser |
Thr |
Val |
Trp |
Tyr |
|---|---|---|---|---|---|---|---|---|---|
2.823 ± 0.023 | 2.434 ± 0.023 |
4.886 ± 0.027 | 3.033 ± 0.025 |
6.855 ± 0.045 | 5.242 ± 0.03 |
5.127 ± 0.031 | 6.893 ± 0.03 |
1.369 ± 0.018 | 2.251 ± 0.022 |
Most of the basic statistics you can see at this page can be downloaded from this CSV file
See this proteome in:

Proteome-pI is available under Creative Commons Attribution-NoDerivs license, for more details see here
| Reference: Kozlowski LP. Proteome-pI 2.0: Proteome Isoelectric Point Database Update. Nucleic Acids Res. 2021, doi: 10.1093/nar/gkab944 | Contact: Lukasz P. Kozlowski |