Rousettus bat coronavirus
Taxonomy: Viruses; Riboviria; Orthornavirae; Pisuviricota; Pisoniviricetes; Nidovirales; Cornidovirineae; Coronaviridae; Orthocoronavirinae; Betacoronavirus; Nobecovirus; Rousettus bat coronavirus GCCDC1
Average proteome isoelectric point is 6.77
Get precalculated fractions of proteins
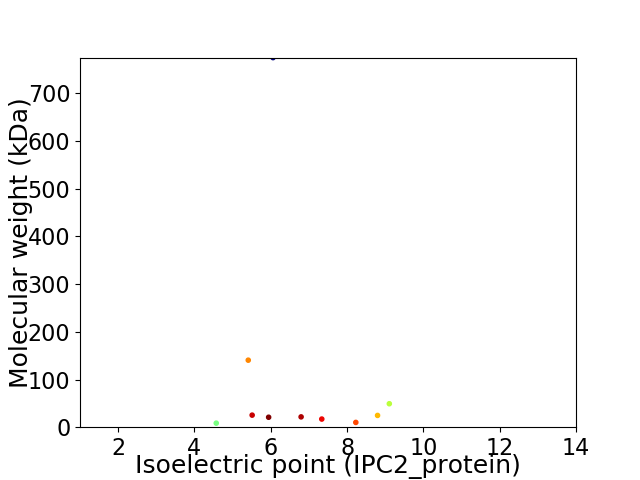
Virtual 2D-PAGE plot for 10 proteins (isoelectric point calculated using IPC2_protein)
Get csv file with sequences according to given criteria:
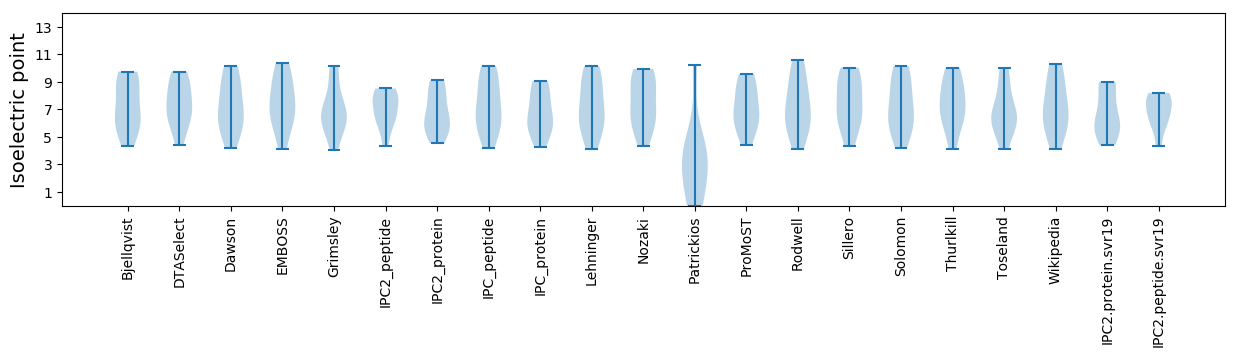
* You can choose from 21 different methods for calculating isoelectric point
Summary statistics related to proteome-wise predictions
Protein with the lowest isoelectric point:
>tr|A0A1B3Q5X0|A0A1B3Q5X0_9BETC Nucleocapsid protein OS=Rousettus bat coronavirus OX=1892416 GN=N PE=4 SV=1
MM1 pKa = 7.25YY2 pKa = 9.96EE3 pKa = 4.2LVGTDD8 pKa = 3.36TSVLIANVLVLIVLCVCIVIVGCAVLLILQFIVSTCTCFFTSVCKK53 pKa = 8.51PTVYY57 pKa = 9.99IYY59 pKa = 11.41NKK61 pKa = 9.95FKK63 pKa = 10.99YY64 pKa = 9.92DD65 pKa = 3.44SLSNEE70 pKa = 3.97QEE72 pKa = 4.02EE73 pKa = 4.51LLLL76 pKa = 5.14
MM1 pKa = 7.25YY2 pKa = 9.96EE3 pKa = 4.2LVGTDD8 pKa = 3.36TSVLIANVLVLIVLCVCIVIVGCAVLLILQFIVSTCTCFFTSVCKK53 pKa = 8.51PTVYY57 pKa = 9.99IYY59 pKa = 11.41NKK61 pKa = 9.95FKK63 pKa = 10.99YY64 pKa = 9.92DD65 pKa = 3.44SLSNEE70 pKa = 3.97QEE72 pKa = 4.02EE73 pKa = 4.51LLLL76 pKa = 5.14
Molecular weight: 8.47 kDa
Isoelectric point according different methods:
Protein with the highest isoelectric point:
>tr|A0A1B3IZG9|A0A1B3IZG9_9BETC NS7a protein OS=Rousettus bat coronavirus OX=1892416 GN=NS7a PE=4 SV=1
MM1 pKa = 7.7GDD3 pKa = 3.94CNGMWSIFGSTNCNSAKK20 pKa = 9.12NTAGGNLEE28 pKa = 4.09ATNVLITYY36 pKa = 8.92GPYY39 pKa = 9.89LAAIVGLLLLVCLFYY54 pKa = 11.06CCYY57 pKa = 10.73LKK59 pKa = 10.88FKK61 pKa = 10.82ASQAKK66 pKa = 7.87KK67 pKa = 8.32TYY69 pKa = 9.19RR70 pKa = 11.84KK71 pKa = 9.57EE72 pKa = 4.31LISLTTRR79 pKa = 11.84QIYY82 pKa = 10.13APPRR86 pKa = 11.84EE87 pKa = 4.14ISHH90 pKa = 5.44VV91 pKa = 3.48
MM1 pKa = 7.7GDD3 pKa = 3.94CNGMWSIFGSTNCNSAKK20 pKa = 9.12NTAGGNLEE28 pKa = 4.09ATNVLITYY36 pKa = 8.92GPYY39 pKa = 9.89LAAIVGLLLLVCLFYY54 pKa = 11.06CCYY57 pKa = 10.73LKK59 pKa = 10.88FKK61 pKa = 10.82ASQAKK66 pKa = 7.87KK67 pKa = 8.32TYY69 pKa = 9.19RR70 pKa = 11.84KK71 pKa = 9.57EE72 pKa = 4.31LISLTTRR79 pKa = 11.84QIYY82 pKa = 10.13APPRR86 pKa = 11.84EE87 pKa = 4.14ISHH90 pKa = 5.44VV91 pKa = 3.48
Molecular weight: 10.03 kDa
Isoelectric point according different methods:
Peptides (in silico digests for buttom-up proteomics)
Below you can find in silico digests of the whole proteome with Trypsin, Chymotrypsin, Trypsin+LysC, LysN, ArgC proteases suitable for different mass spec machines.| Try ESI |
 |
|---|
| ChTry ESI |
|
|---|
| ArgC ESI |
|
|---|
| LysN ESI |
|
|---|
| TryLysC ESI |
|
|---|
| Try MALDI |
|
|---|
| ChTry MALDI |
|
|---|
| ArgC MALDI |
|
|---|
| LysN MALDI |
|
|---|
| TryLysC MALDI |
|
|---|
| Try LTQ |
|
|---|
| ChTry LTQ |
|
|---|
| ArgC LTQ |
|
|---|
| LysN LTQ |
|
|---|
| TryLysC LTQ |
|
|---|
| Try MSlow |
|
|---|
| ChTry MSlow |
|
|---|
| ArgC MSlow |
|
|---|
| LysN MSlow |
|
|---|
| TryLysC MSlow |
|
|---|
| Try MShigh |
|
|---|
| ChTry MShigh |
|
|---|
| ArgC MShigh |
|
|---|
| LysN MShigh |
|
|---|
| TryLysC MShigh |
|
|---|
General Statistics
Number of major isoforms |
Number of additional isoforms |
Number of all proteins |
Number of amino acids |
Min. Seq. Length |
Max. Seq. Length |
Avg. Seq. Length |
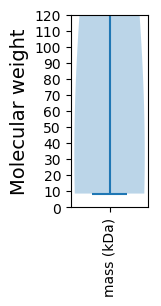
Avg. Mol. Weight |
|---|---|---|---|---|---|---|---|
0 |
9851 |
76 |
6973 |
985.1 |
109.29 |
Amino acid frequency
Ala |
Cys |
Asp |
Glu |
Phe |
Gly |
His |
Ile |
Lys |
Leu |
|---|---|---|---|---|---|---|---|---|---|
7.654 ± 0.331 | 3.238 ± 0.298 |
5.045 ± 0.501 | 4.223 ± 0.291 |
4.446 ± 0.313 | 6.223 ± 0.276 |
1.979 ± 0.344 | 4.132 ± 0.541 |
4.883 ± 0.705 | 9.644 ± 0.524 |
Met |
Asn |
Gln |
Pro |
Arg |
Ser |
Thr |
Val |
Trp |
Tyr |
|---|---|---|---|---|---|---|---|---|---|
2.223 ± 0.213 | 4.781 ± 0.679 |
4.599 ± 0.355 | 3.441 ± 0.315 |
4.101 ± 0.583 | 6.761 ± 0.351 |
6.74 ± 0.414 | 9.928 ± 0.635 |
1.33 ± 0.2 | 4.629 ± 0.553 |
Most of the basic statistics you can see at this page can be downloaded from this CSV file
See this proteome in:

Proteome-pI is available under Creative Commons Attribution-NoDerivs license, for more details see here
| Reference: Kozlowski LP. Proteome-pI 2.0: Proteome Isoelectric Point Database Update. Nucleic Acids Res. 2021, doi: 10.1093/nar/gkab944 | Contact: Lukasz P. Kozlowski |