Escherichia phage vB_EcoS Sa179lw
Taxonomy: Viruses; Duplodnaviria; Heunggongvirae; Uroviricota; Caudoviricetes; Caudovirales; Siphoviridae; unclassified Siphoviridae
Average proteome isoelectric point is 6.41
Get precalculated fractions of proteins
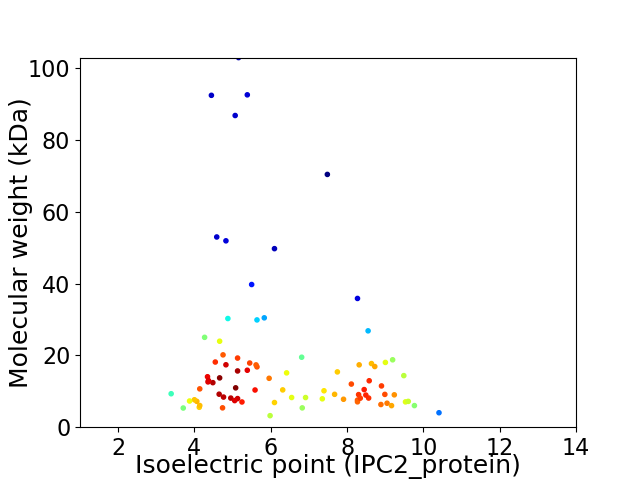
Virtual 2D-PAGE plot for 86 proteins (isoelectric point calculated using IPC2_protein)
Get csv file with sequences according to given criteria:
* You can choose from 21 different methods for calculating isoelectric point
Summary statistics related to proteome-wise predictions

Protein with the lowest isoelectric point:
>tr|A0A2P1MXD3|A0A2P1MXD3_9CAUD Putative type III restriction endonuclease OS=Escherichia phage vB_EcoS Sa179lw OX=2126819 GN=vBEcoSSa179w3YLVW_00034 PE=4 SV=1
MM1 pKa = 6.99SQWIKK6 pKa = 10.14CSEE9 pKa = 4.21MMPPTNVAVLVCVNEE24 pKa = 4.33VVQKK28 pKa = 11.14NVFCWDD34 pKa = 3.44GEE36 pKa = 4.6SWSDD40 pKa = 2.87WYY42 pKa = 11.46NEE44 pKa = 3.71YY45 pKa = 11.05DD46 pKa = 3.92EE47 pKa = 5.77LAQTTFDD54 pKa = 3.02HH55 pKa = 6.74WMPLPGPPQEE65 pKa = 4.16
MM1 pKa = 6.99SQWIKK6 pKa = 10.14CSEE9 pKa = 4.21MMPPTNVAVLVCVNEE24 pKa = 4.33VVQKK28 pKa = 11.14NVFCWDD34 pKa = 3.44GEE36 pKa = 4.6SWSDD40 pKa = 2.87WYY42 pKa = 11.46NEE44 pKa = 3.71YY45 pKa = 11.05DD46 pKa = 3.92EE47 pKa = 5.77LAQTTFDD54 pKa = 3.02HH55 pKa = 6.74WMPLPGPPQEE65 pKa = 4.16
Molecular weight: 7.64 kDa
Isoelectric point according different methods:
Protein with the highest isoelectric point:
>tr|A0A2P1MXE5|A0A2P1MXE5_9CAUD Transcriptional activator protein C1 OS=Escherichia phage vB_EcoS Sa179lw OX=2126819 GN=C1 PE=4 SV=1
MM1 pKa = 7.8AKK3 pKa = 9.86TIYY6 pKa = 9.96RR7 pKa = 11.84RR8 pKa = 11.84EE9 pKa = 4.01KK10 pKa = 10.21LEE12 pKa = 3.76QEE14 pKa = 4.24LGHH17 pKa = 7.05VGAQNFMSKK26 pKa = 7.49QARR29 pKa = 11.84NAMEE33 pKa = 4.66SIRR36 pKa = 11.84VNRR39 pKa = 11.84VVRR42 pKa = 11.84VFNGEE47 pKa = 3.69GKK49 pKa = 10.08RR50 pKa = 11.84RR51 pKa = 11.84VMDD54 pKa = 3.54EE55 pKa = 4.36LIIVFF60 pKa = 4.5
MM1 pKa = 7.8AKK3 pKa = 9.86TIYY6 pKa = 9.96RR7 pKa = 11.84RR8 pKa = 11.84EE9 pKa = 4.01KK10 pKa = 10.21LEE12 pKa = 3.76QEE14 pKa = 4.24LGHH17 pKa = 7.05VGAQNFMSKK26 pKa = 7.49QARR29 pKa = 11.84NAMEE33 pKa = 4.66SIRR36 pKa = 11.84VNRR39 pKa = 11.84VVRR42 pKa = 11.84VFNGEE47 pKa = 3.69GKK49 pKa = 10.08RR50 pKa = 11.84RR51 pKa = 11.84VMDD54 pKa = 3.54EE55 pKa = 4.36LIIVFF60 pKa = 4.5
Molecular weight: 7.05 kDa
Isoelectric point according different methods:
Peptides (in silico digests for buttom-up proteomics)
Below you can find in silico digests of the whole proteome with Trypsin, Chymotrypsin, Trypsin+LysC, LysN, ArgC proteases suitable for different mass spec machines.| Try ESI |
 |
|---|
| ChTry ESI |
|
|---|
| ArgC ESI |
|
|---|
| LysN ESI |
|
|---|
| TryLysC ESI |
|
|---|
| Try MALDI |
|
|---|
| ChTry MALDI |
|
|---|
| ArgC MALDI |
|
|---|
| LysN MALDI |
|
|---|
| TryLysC MALDI |
|
|---|
| Try LTQ |
|
|---|
| ChTry LTQ |
|
|---|
| ArgC LTQ |
|
|---|
| LysN LTQ |
|
|---|
| TryLysC LTQ |
|
|---|
| Try MSlow |
|
|---|
| ChTry MSlow |
|
|---|
| ArgC MSlow |
|
|---|
| LysN MSlow |
|
|---|
| TryLysC MSlow |
|
|---|
| Try MShigh |
|
|---|
| ChTry MShigh |
|
|---|
| ArgC MShigh |
|
|---|
| LysN MShigh |
|
|---|
| TryLysC MShigh |
|
|---|
General Statistics
Number of major isoforms |
Number of additional isoforms |
Number of all proteins |
Number of amino acids |
Min. Seq. Length |
Max. Seq. Length |
Avg. Seq. Length |
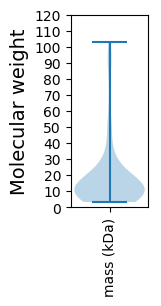
Avg. Mol. Weight |
|---|---|---|---|---|---|---|---|
0 |
14311 |
31 |
980 |
166.4 |
18.62 |
Amino acid frequency
Ala |
Cys |
Asp |
Glu |
Phe |
Gly |
His |
Ile |
Lys |
Leu |
|---|---|---|---|---|---|---|---|---|---|
8.776 ± 0.646 | 1.384 ± 0.173 |
6.219 ± 0.271 | 6.792 ± 0.322 |
3.606 ± 0.185 | 6.764 ± 0.209 |
1.607 ± 0.179 | 6.673 ± 0.269 |
6.275 ± 0.325 | 6.834 ± 0.23 |
Met |
Asn |
Gln |
Pro |
Arg |
Ser |
Thr |
Val |
Trp |
Tyr |
|---|---|---|---|---|---|---|---|---|---|
3.347 ± 0.189 | 4.842 ± 0.193 |
3.382 ± 0.275 | 3.794 ± 0.395 |
5.017 ± 0.232 | 6.701 ± 0.343 |
5.765 ± 0.425 | 6.834 ± 0.247 |
1.474 ± 0.147 | 3.913 ± 0.223 |
Most of the basic statistics you can see at this page can be downloaded from this CSV file
See this proteome in:

Proteome-pI is available under Creative Commons Attribution-NoDerivs license, for more details see here
| Reference: Kozlowski LP. Proteome-pI 2.0: Proteome Isoelectric Point Database Update. Nucleic Acids Res. 2021, doi: 10.1093/nar/gkab944 | Contact: Lukasz P. Kozlowski |