Nitrospirales bacterium LBB_01
Taxonomy: cellular organisms; Bacteria; Nitrospirae; Nitrospira; Nitrospirales; unclassified Nitrospirales
Average proteome isoelectric point is 6.68
Get precalculated fractions of proteins
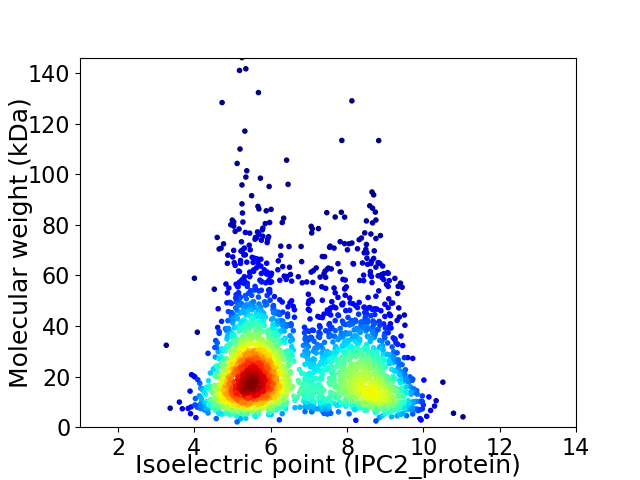
Virtual 2D-PAGE plot for 2708 proteins (isoelectric point calculated using IPC2_protein)
Get csv file with sequences according to given criteria:
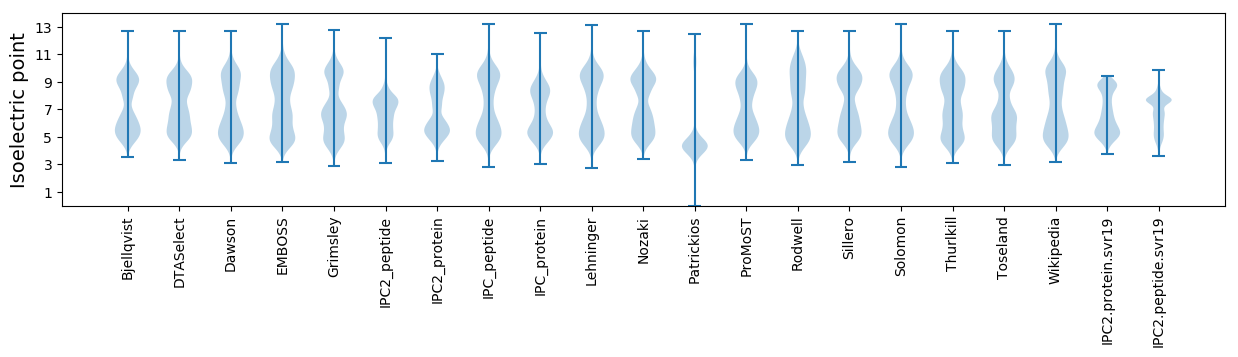
* You can choose from 21 different methods for calculating isoelectric point
Summary statistics related to proteome-wise predictions
Protein with the lowest isoelectric point:
>tr|A0A4Y7X592|A0A4Y7X592_9BACT Uncharacterized protein OS=Nitrospirales bacterium LBB_01 OX=2552947 GN=E2O03_06600 PE=4 SV=1
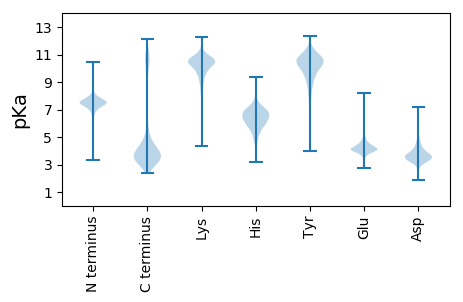
MM1 pKa = 7.63IKK3 pKa = 10.49LGDD6 pKa = 3.35ITLPNDD12 pKa = 3.86LTWPNCFEE20 pKa = 3.86WTGISEE26 pKa = 4.53TVEE29 pKa = 3.91RR30 pKa = 11.84TLSGDD35 pKa = 3.39VVIYY39 pKa = 8.8GTEE42 pKa = 3.56ITGRR46 pKa = 11.84TIDD49 pKa = 3.57LTGGSDD55 pKa = 3.87YY56 pKa = 11.66GWITYY61 pKa = 10.3KK62 pKa = 10.6DD63 pKa = 4.15LKK65 pKa = 9.92TLLDD69 pKa = 3.51MASVYY74 pKa = 10.77EE75 pKa = 4.26EE76 pKa = 4.56IYY78 pKa = 11.1
MM1 pKa = 7.63IKK3 pKa = 10.49LGDD6 pKa = 3.35ITLPNDD12 pKa = 3.86LTWPNCFEE20 pKa = 3.86WTGISEE26 pKa = 4.53TVEE29 pKa = 3.91RR30 pKa = 11.84TLSGDD35 pKa = 3.39VVIYY39 pKa = 8.8GTEE42 pKa = 3.56ITGRR46 pKa = 11.84TIDD49 pKa = 3.57LTGGSDD55 pKa = 3.87YY56 pKa = 11.66GWITYY61 pKa = 10.3KK62 pKa = 10.6DD63 pKa = 4.15LKK65 pKa = 9.92TLLDD69 pKa = 3.51MASVYY74 pKa = 10.77EE75 pKa = 4.26EE76 pKa = 4.56IYY78 pKa = 11.1
Molecular weight: 8.8 kDa
Isoelectric point according different methods:
Protein with the highest isoelectric point:
>tr|A0A4Y7X511|A0A4Y7X511_9BACT Glycosyltransferase family 1 protein (Fragment) OS=Nitrospirales bacterium LBB_01 OX=2552947 GN=E2O03_05995 PE=4 SV=1
MM1 pKa = 7.47GNVKK5 pKa = 9.7KK6 pKa = 9.58WRR8 pKa = 11.84KK9 pKa = 9.84KK10 pKa = 9.99KK11 pKa = 9.66MSKK14 pKa = 10.02HH15 pKa = 3.98KK16 pKa = 10.12HH17 pKa = 4.57KK18 pKa = 10.73KK19 pKa = 9.25LRR21 pKa = 11.84RR22 pKa = 11.84KK23 pKa = 9.1MKK25 pKa = 8.64FQRR28 pKa = 11.84RR29 pKa = 11.84RR30 pKa = 11.84KK31 pKa = 9.33
MM1 pKa = 7.47GNVKK5 pKa = 9.7KK6 pKa = 9.58WRR8 pKa = 11.84KK9 pKa = 9.84KK10 pKa = 9.99KK11 pKa = 9.66MSKK14 pKa = 10.02HH15 pKa = 3.98KK16 pKa = 10.12HH17 pKa = 4.57KK18 pKa = 10.73KK19 pKa = 9.25LRR21 pKa = 11.84RR22 pKa = 11.84KK23 pKa = 9.1MKK25 pKa = 8.64FQRR28 pKa = 11.84RR29 pKa = 11.84RR30 pKa = 11.84KK31 pKa = 9.33
Molecular weight: 4.09 kDa
Isoelectric point according different methods:
Peptides (in silico digests for buttom-up proteomics)
Below you can find in silico digests of the whole proteome with Trypsin, Chymotrypsin, Trypsin+LysC, LysN, ArgC proteases suitable for different mass spec machines.| Try ESI |
 |
|---|
| ChTry ESI |
|
|---|
| ArgC ESI |
|
|---|
| LysN ESI |
|
|---|
| TryLysC ESI |
|
|---|
| Try MALDI |
|
|---|
| ChTry MALDI |
|
|---|
| ArgC MALDI |
|
|---|
| LysN MALDI |
|
|---|
| TryLysC MALDI |
|
|---|
| Try LTQ |
|
|---|
| ChTry LTQ |
|
|---|
| ArgC LTQ |
|
|---|
| LysN LTQ |
|
|---|
| TryLysC LTQ |
|
|---|
| Try MSlow |
|
|---|
| ChTry MSlow |
|
|---|
| ArgC MSlow |
|
|---|
| LysN MSlow |
|
|---|
| TryLysC MSlow |
|
|---|
| Try MShigh |
|
|---|
| ChTry MShigh |
|
|---|
| ArgC MShigh |
|
|---|
| LysN MShigh |
|
|---|
| TryLysC MShigh |
|
|---|
General Statistics
Number of major isoforms |
Number of additional isoforms |
Number of all proteins |
Number of amino acids |
Min. Seq. Length |
Max. Seq. Length |
Avg. Seq. Length |
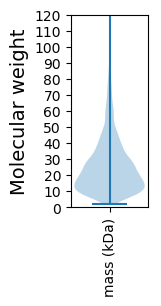
Avg. Mol. Weight |
|---|---|---|---|---|---|---|---|
0 |
637417 |
18 |
1274 |
235.4 |
26.33 |
Amino acid frequency
Ala |
Cys |
Asp |
Glu |
Phe |
Gly |
His |
Ile |
Lys |
Leu |
|---|---|---|---|---|---|---|---|---|---|
7.169 ± 0.053 | 1.127 ± 0.025 |
5.506 ± 0.037 | 6.386 ± 0.051 |
4.656 ± 0.047 | 6.486 ± 0.048 |
1.908 ± 0.023 | 8.089 ± 0.043 |
7.337 ± 0.048 | 9.651 ± 0.053 |
Met |
Asn |
Gln |
Pro |
Arg |
Ser |
Thr |
Val |
Trp |
Tyr |
|---|---|---|---|---|---|---|---|---|---|
2.72 ± 0.023 | 4.392 ± 0.032 |
3.592 ± 0.032 | 2.6 ± 0.026 |
4.279 ± 0.034 | 6.784 ± 0.048 |
5.82 ± 0.041 | 7.08 ± 0.041 |
0.838 ± 0.018 | 3.581 ± 0.034 |
Most of the basic statistics you can see at this page can be downloaded from this CSV file
See this proteome in:

Proteome-pI is available under Creative Commons Attribution-NoDerivs license, for more details see here
| Reference: Kozlowski LP. Proteome-pI 2.0: Proteome Isoelectric Point Database Update. Nucleic Acids Res. 2021, doi: 10.1093/nar/gkab944 | Contact: Lukasz P. Kozlowski |