Bacillus phage Gxv1
Taxonomy: Viruses; Duplodnaviria; Heunggongvirae; Uroviricota; Caudoviricetes; Caudovirales; Salasmaviridae; Picovirinae; Salasvirus; Bacillus virus Gxv1
Average proteome isoelectric point is 6.53
Get precalculated fractions of proteins
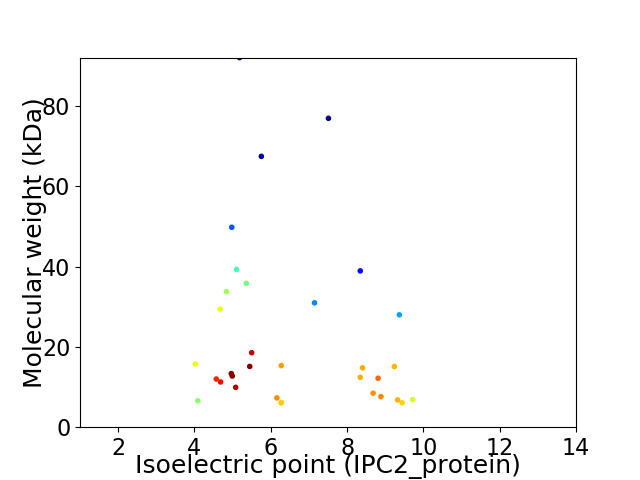
Virtual 2D-PAGE plot for 33 proteins (isoelectric point calculated using IPC2_protein)
Get csv file with sequences according to given criteria:
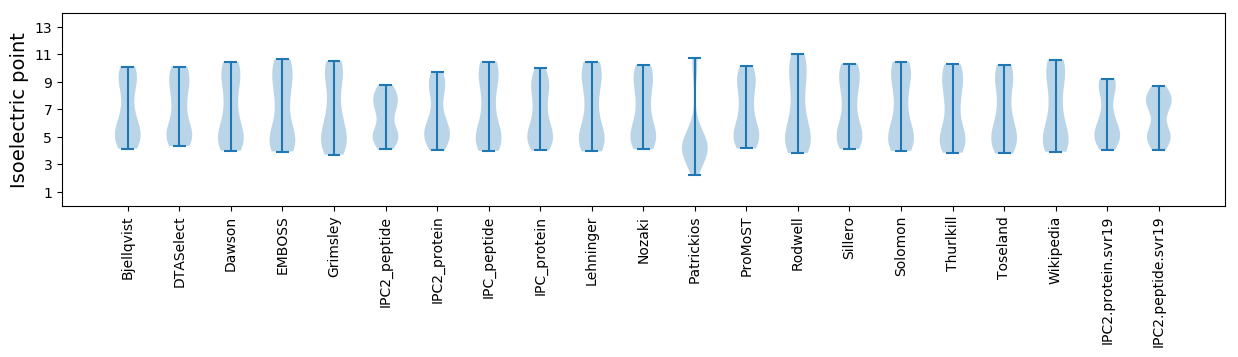
* You can choose from 21 different methods for calculating isoelectric point
Summary statistics related to proteome-wise predictions
Protein with the lowest isoelectric point:
>tr|A0A6M9Z7E5|A0A6M9Z7E5_9CAUD Morphogenesis protein OS=Bacillus phage Gxv1 OX=2736266 PE=4 SV=1
MM1 pKa = 6.55VQNDD5 pKa = 3.87FVDD8 pKa = 4.13SYY10 pKa = 11.74DD11 pKa = 3.58VTMLLQDD18 pKa = 4.71DD19 pKa = 4.87DD20 pKa = 4.15GKK22 pKa = 11.02QYY24 pKa = 11.3YY25 pKa = 9.11EE26 pKa = 3.93YY27 pKa = 10.81HH28 pKa = 6.64KK29 pKa = 10.8GLSLSDD35 pKa = 3.86FEE37 pKa = 4.66VLYY40 pKa = 11.22GNTADD45 pKa = 4.77EE46 pKa = 4.67IIKK49 pKa = 10.58LRR51 pKa = 11.84LDD53 pKa = 3.13KK54 pKa = 10.79MLL56 pKa = 4.73
MM1 pKa = 6.55VQNDD5 pKa = 3.87FVDD8 pKa = 4.13SYY10 pKa = 11.74DD11 pKa = 3.58VTMLLQDD18 pKa = 4.71DD19 pKa = 4.87DD20 pKa = 4.15GKK22 pKa = 11.02QYY24 pKa = 11.3YY25 pKa = 9.11EE26 pKa = 3.93YY27 pKa = 10.81HH28 pKa = 6.64KK29 pKa = 10.8GLSLSDD35 pKa = 3.86FEE37 pKa = 4.66VLYY40 pKa = 11.22GNTADD45 pKa = 4.77EE46 pKa = 4.67IIKK49 pKa = 10.58LRR51 pKa = 11.84LDD53 pKa = 3.13KK54 pKa = 10.79MLL56 pKa = 4.73
Molecular weight: 6.6 kDa
Isoelectric point according different methods:
Protein with the highest isoelectric point:
>tr|A0A6M9Z6Y1|A0A6M9Z6Y1_9CAUD Head morphogensis protein OS=Bacillus phage Gxv1 OX=2736266 PE=4 SV=1
MM1 pKa = 7.18SRR3 pKa = 11.84LWKK6 pKa = 10.36SISFSITYY14 pKa = 10.26RR15 pKa = 11.84GGNKK19 pKa = 8.89MNQKK23 pKa = 9.48EE24 pKa = 4.21FQAVLDD30 pKa = 3.7WMLSHH35 pKa = 7.45TIIQFHH41 pKa = 7.02EE42 pKa = 4.22YY43 pKa = 10.86NYY45 pKa = 9.75MLQKK49 pKa = 10.53SLPFLRR55 pKa = 11.84RR56 pKa = 3.17
MM1 pKa = 7.18SRR3 pKa = 11.84LWKK6 pKa = 10.36SISFSITYY14 pKa = 10.26RR15 pKa = 11.84GGNKK19 pKa = 8.89MNQKK23 pKa = 9.48EE24 pKa = 4.21FQAVLDD30 pKa = 3.7WMLSHH35 pKa = 7.45TIIQFHH41 pKa = 7.02EE42 pKa = 4.22YY43 pKa = 10.86NYY45 pKa = 9.75MLQKK49 pKa = 10.53SLPFLRR55 pKa = 11.84RR56 pKa = 3.17
Molecular weight: 6.87 kDa
Isoelectric point according different methods:
Peptides (in silico digests for buttom-up proteomics)
Below you can find in silico digests of the whole proteome with Trypsin, Chymotrypsin, Trypsin+LysC, LysN, ArgC proteases suitable for different mass spec machines.| Try ESI |
 |
|---|
| ChTry ESI |
|
|---|
| ArgC ESI |
|
|---|
| LysN ESI |
|
|---|
| TryLysC ESI |
|
|---|
| Try MALDI |
|
|---|
| ChTry MALDI |
|
|---|
| ArgC MALDI |
|
|---|
| LysN MALDI |
|
|---|
| TryLysC MALDI |
|
|---|
| Try LTQ |
|
|---|
| ChTry LTQ |
|
|---|
| ArgC LTQ |
|
|---|
| LysN LTQ |
|
|---|
| TryLysC LTQ |
|
|---|
| Try MSlow |
|
|---|
| ChTry MSlow |
|
|---|
| ArgC MSlow |
|
|---|
| LysN MSlow |
|
|---|
| TryLysC MSlow |
|
|---|
| Try MShigh |
|
|---|
| ChTry MShigh |
|
|---|
| ArgC MShigh |
|
|---|
| LysN MShigh |
|
|---|
| TryLysC MShigh |
|
|---|
General Statistics
Number of major isoforms |
Number of additional isoforms |
Number of all proteins |
Number of amino acids |
Min. Seq. Length |
Max. Seq. Length |
Avg. Seq. Length |
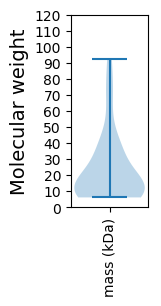
Avg. Mol. Weight |
|---|---|---|---|---|---|---|---|
0 |
6740 |
53 |
854 |
204.2 |
23.14 |
Amino acid frequency
Ala |
Cys |
Asp |
Glu |
Phe |
Gly |
His |
Ile |
Lys |
Leu |
|---|---|---|---|---|---|---|---|---|---|
5.475 ± 0.367 | 0.801 ± 0.171 |
6.365 ± 0.332 | 6.513 ± 0.42 |
4.347 ± 0.371 | 6.558 ± 0.757 |
1.484 ± 0.124 | 6.766 ± 0.271 |
7.418 ± 0.48 | 8.027 ± 0.35 |
Met |
Asn |
Gln |
Pro |
Arg |
Ser |
Thr |
Val |
Trp |
Tyr |
|---|---|---|---|---|---|---|---|---|---|
2.7 ± 0.245 | 6.78 ± 0.516 |
2.745 ± 0.176 | 3.591 ± 0.292 |
4.362 ± 0.309 | 6.884 ± 0.421 |
6.439 ± 0.477 | 6.914 ± 0.462 |
1.202 ± 0.207 | 4.525 ± 0.33 |
Most of the basic statistics you can see at this page can be downloaded from this CSV file
See this proteome in:

Proteome-pI is available under Creative Commons Attribution-NoDerivs license, for more details see here
| Reference: Kozlowski LP. Proteome-pI 2.0: Proteome Isoelectric Point Database Update. Nucleic Acids Res. 2021, doi: 10.1093/nar/gkab944 | Contact: Lukasz P. Kozlowski |