Synechococcus phage S-EIVl
Taxonomy: Viruses; unclassified bacterial viruses
Average proteome isoelectric point is 6.07
Get precalculated fractions of proteins
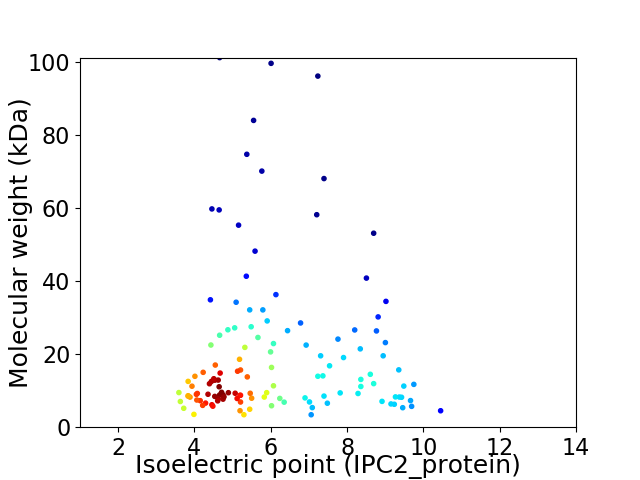
Virtual 2D-PAGE plot for 129 proteins (isoelectric point calculated using IPC2_protein)
Get csv file with sequences according to given criteria:
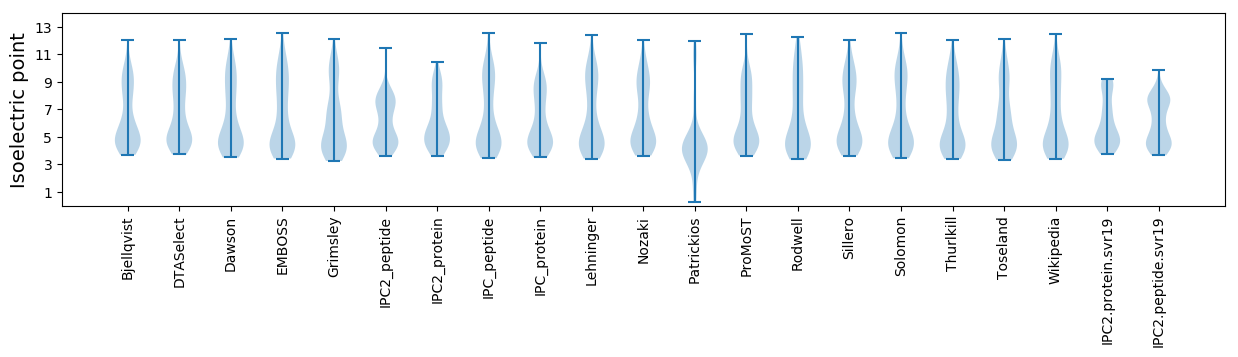
* You can choose from 21 different methods for calculating isoelectric point
Summary statistics related to proteome-wise predictions
Protein with the lowest isoelectric point:
>tr|A0A0C4K413|A0A0C4K413_9VIRU Uncharacterized protein OS=Synechococcus phage S-EIVl OX=1468179 PE=4 SV=1
MM1 pKa = 7.55TEE3 pKa = 4.0HH4 pKa = 7.06TDD6 pKa = 3.52EE7 pKa = 4.45QLLAMAMANLGEE19 pKa = 4.35YY20 pKa = 9.48IHH22 pKa = 7.37DD23 pKa = 4.31GSLHH27 pKa = 6.08YY28 pKa = 10.49ILIEE32 pKa = 3.88EE33 pKa = 4.62DD34 pKa = 3.2PRR36 pKa = 11.84NDD38 pKa = 3.13EE39 pKa = 6.4DD40 pKa = 4.9YY41 pKa = 9.83DD42 pKa = 3.58TWEE45 pKa = 4.12VGMEE49 pKa = 4.42PLPGDD54 pKa = 3.92HH55 pKa = 6.68TWRR58 pKa = 11.84AASIDD63 pKa = 3.77VAVSPTEE70 pKa = 4.01STDD73 pKa = 2.98
MM1 pKa = 7.55TEE3 pKa = 4.0HH4 pKa = 7.06TDD6 pKa = 3.52EE7 pKa = 4.45QLLAMAMANLGEE19 pKa = 4.35YY20 pKa = 9.48IHH22 pKa = 7.37DD23 pKa = 4.31GSLHH27 pKa = 6.08YY28 pKa = 10.49ILIEE32 pKa = 3.88EE33 pKa = 4.62DD34 pKa = 3.2PRR36 pKa = 11.84NDD38 pKa = 3.13EE39 pKa = 6.4DD40 pKa = 4.9YY41 pKa = 9.83DD42 pKa = 3.58TWEE45 pKa = 4.12VGMEE49 pKa = 4.42PLPGDD54 pKa = 3.92HH55 pKa = 6.68TWRR58 pKa = 11.84AASIDD63 pKa = 3.77VAVSPTEE70 pKa = 4.01STDD73 pKa = 2.98
Molecular weight: 8.25 kDa
Isoelectric point according different methods:
Protein with the highest isoelectric point:
>tr|A0A0C4K424|A0A0C4K424_9VIRU Uncharacterized protein OS=Synechococcus phage S-EIVl OX=1468179 PE=4 SV=1
MM1 pKa = 7.39NKK3 pKa = 9.46VKK5 pKa = 9.72TLTQKK10 pKa = 10.96KK11 pKa = 8.54EE12 pKa = 3.82GRR14 pKa = 11.84PKK16 pKa = 9.97GTRR19 pKa = 11.84QGQGMSSKK27 pKa = 10.09PNHH30 pKa = 5.63GRR32 pKa = 11.84KK33 pKa = 7.91KK34 pKa = 9.21TRR36 pKa = 11.84GQGKK40 pKa = 9.23GG41 pKa = 3.16
MM1 pKa = 7.39NKK3 pKa = 9.46VKK5 pKa = 9.72TLTQKK10 pKa = 10.96KK11 pKa = 8.54EE12 pKa = 3.82GRR14 pKa = 11.84PKK16 pKa = 9.97GTRR19 pKa = 11.84QGQGMSSKK27 pKa = 10.09PNHH30 pKa = 5.63GRR32 pKa = 11.84KK33 pKa = 7.91KK34 pKa = 9.21TRR36 pKa = 11.84GQGKK40 pKa = 9.23GG41 pKa = 3.16
Molecular weight: 4.51 kDa
Isoelectric point according different methods:
Peptides (in silico digests for buttom-up proteomics)
Below you can find in silico digests of the whole proteome with Trypsin, Chymotrypsin, Trypsin+LysC, LysN, ArgC proteases suitable for different mass spec machines.| Try ESI |
 |
|---|
| ChTry ESI |
|
|---|
| ArgC ESI |
|
|---|
| LysN ESI |
|
|---|
| TryLysC ESI |
|
|---|
| Try MALDI |
|
|---|
| ChTry MALDI |
|
|---|
| ArgC MALDI |
|
|---|
| LysN MALDI |
|
|---|
| TryLysC MALDI |
|
|---|
| Try LTQ |
|
|---|
| ChTry LTQ |
|
|---|
| ArgC LTQ |
|
|---|
| LysN LTQ |
|
|---|
| TryLysC LTQ |
|
|---|
| Try MSlow |
|
|---|
| ChTry MSlow |
|
|---|
| ArgC MSlow |
|
|---|
| LysN MSlow |
|
|---|
| TryLysC MSlow |
|
|---|
| Try MShigh |
|
|---|
| ChTry MShigh |
|
|---|
| ArgC MShigh |
|
|---|
| LysN MShigh |
|
|---|
| TryLysC MShigh |
|
|---|
General Statistics
Number of major isoforms |
Number of additional isoforms |
Number of all proteins |
Number of amino acids |
Min. Seq. Length |
Max. Seq. Length |
Avg. Seq. Length |
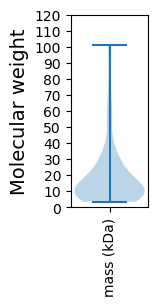
Avg. Mol. Weight |
|---|---|---|---|---|---|---|---|
0 |
23154 |
29 |
901 |
179.5 |
19.87 |
Amino acid frequency
Ala |
Cys |
Asp |
Glu |
Phe |
Gly |
His |
Ile |
Lys |
Leu |
|---|---|---|---|---|---|---|---|---|---|
8.292 ± 0.361 | 1.037 ± 0.11 |
5.818 ± 0.234 | 6.37 ± 0.334 |
3.779 ± 0.159 | 8.12 ± 0.412 |
1.468 ± 0.148 | 5.23 ± 0.202 |
5.727 ± 0.355 | 8.15 ± 0.228 |
Met |
Asn |
Gln |
Pro |
Arg |
Ser |
Thr |
Val |
Trp |
Tyr |
|---|---|---|---|---|---|---|---|---|---|
2.501 ± 0.165 | 4.604 ± 0.172 |
4.846 ± 0.25 | 4.872 ± 0.205 |
4.846 ± 0.235 | 6.457 ± 0.225 |
7.126 ± 0.569 | 5.783 ± 0.248 |
1.386 ± 0.124 | 3.589 ± 0.156 |
Most of the basic statistics you can see at this page can be downloaded from this CSV file
See this proteome in:

Proteome-pI is available under Creative Commons Attribution-NoDerivs license, for more details see here
| Reference: Kozlowski LP. Proteome-pI 2.0: Proteome Isoelectric Point Database Update. Nucleic Acids Res. 2021, doi: 10.1093/nar/gkab944 | Contact: Lukasz P. Kozlowski |