Cellulomonas sp. KH9
Taxonomy: cellular organisms; Bacteria; Terrabacteria group; Actinobacteria; Actinomycetia; Micrococcales; Cellulomonadaceae; Cellulomonas; unclassified Cellulomonas
Average proteome isoelectric point is 6.15
Get precalculated fractions of proteins
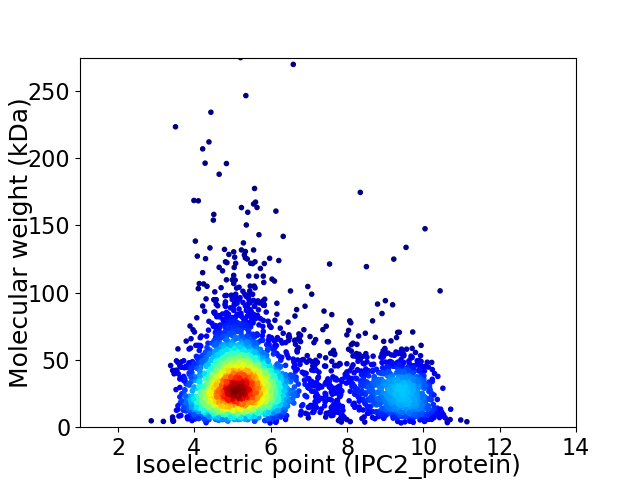
Virtual 2D-PAGE plot for 3696 proteins (isoelectric point calculated using IPC2_protein)
Get csv file with sequences according to given criteria:
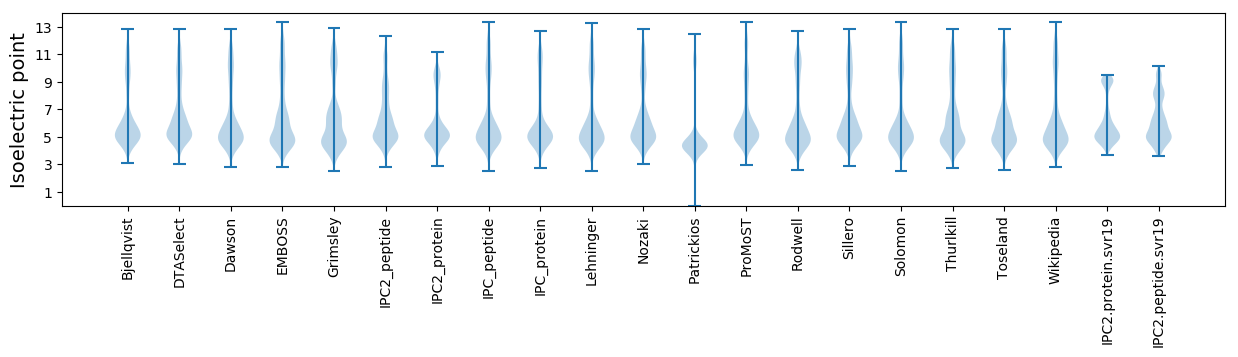
* You can choose from 21 different methods for calculating isoelectric point
Summary statistics related to proteome-wise predictions
Protein with the lowest isoelectric point:
>tr|A0A1I3U2F3|A0A1I3U2F3_9CELL Allantoinase OS=Cellulomonas sp. KH9 OX=1855324 GN=SAMN05216467_0891 PE=4 SV=1
MM1 pKa = 7.6RR2 pKa = 11.84TTKK5 pKa = 10.44NSRR8 pKa = 11.84TAVLTTGAVAALLALTACAGSSSAAEE34 pKa = 4.12GAGEE38 pKa = 4.01VTYY41 pKa = 10.89PEE43 pKa = 4.73LADD46 pKa = 3.47SAACVEE52 pKa = 4.49LRR54 pKa = 11.84EE55 pKa = 4.16QNPDD59 pKa = 3.1LVGTTKK65 pKa = 10.46TNALNPHH72 pKa = 5.18TPGYY76 pKa = 10.45EE77 pKa = 4.02VVNPEE82 pKa = 4.25NPDD85 pKa = 2.99EE86 pKa = 5.02FMGFDD91 pKa = 3.99IDD93 pKa = 5.04LGDD96 pKa = 5.7AIGDD100 pKa = 3.86CLGFDD105 pKa = 3.58VDD107 pKa = 3.99YY108 pKa = 11.17LPVGFSEE115 pKa = 4.74LVPTVASGQADD126 pKa = 4.09WIISNLYY133 pKa = 8.08ATEE136 pKa = 3.95EE137 pKa = 4.12RR138 pKa = 11.84AHH140 pKa = 6.5GGVDD144 pKa = 4.48FISYY148 pKa = 10.73SKK150 pKa = 11.02VFDD153 pKa = 5.15GILVTTGNPQGITGIDD169 pKa = 3.24TSLCGTTVALNKK181 pKa = 10.51GYY183 pKa = 11.09VEE185 pKa = 4.43VPLVEE190 pKa = 4.44ALVPEE195 pKa = 4.78CEE197 pKa = 4.21AAGLEE202 pKa = 4.22APTVSLFDD210 pKa = 3.8SSADD214 pKa = 3.46CVQAILAGRR223 pKa = 11.84ADD225 pKa = 3.81AYY227 pKa = 10.18INDD230 pKa = 3.59VNTVRR235 pKa = 11.84GYY237 pKa = 9.86VAQHH241 pKa = 6.96PDD243 pKa = 3.61DD244 pKa = 5.9LDD246 pKa = 3.66TAEE249 pKa = 4.61TVMLDD254 pKa = 3.38YY255 pKa = 11.0EE256 pKa = 4.21IGIGVLQGDD265 pKa = 3.91HH266 pKa = 7.04AFRR269 pKa = 11.84DD270 pKa = 4.02AVQAALVEE278 pKa = 4.37IQDD281 pKa = 4.5SGLQDD286 pKa = 3.39EE287 pKa = 5.46LAGKK291 pKa = 9.43WSLDD295 pKa = 3.5EE296 pKa = 4.23NALAEE301 pKa = 4.18PTVLSVGG308 pKa = 3.6
MM1 pKa = 7.6RR2 pKa = 11.84TTKK5 pKa = 10.44NSRR8 pKa = 11.84TAVLTTGAVAALLALTACAGSSSAAEE34 pKa = 4.12GAGEE38 pKa = 4.01VTYY41 pKa = 10.89PEE43 pKa = 4.73LADD46 pKa = 3.47SAACVEE52 pKa = 4.49LRR54 pKa = 11.84EE55 pKa = 4.16QNPDD59 pKa = 3.1LVGTTKK65 pKa = 10.46TNALNPHH72 pKa = 5.18TPGYY76 pKa = 10.45EE77 pKa = 4.02VVNPEE82 pKa = 4.25NPDD85 pKa = 2.99EE86 pKa = 5.02FMGFDD91 pKa = 3.99IDD93 pKa = 5.04LGDD96 pKa = 5.7AIGDD100 pKa = 3.86CLGFDD105 pKa = 3.58VDD107 pKa = 3.99YY108 pKa = 11.17LPVGFSEE115 pKa = 4.74LVPTVASGQADD126 pKa = 4.09WIISNLYY133 pKa = 8.08ATEE136 pKa = 3.95EE137 pKa = 4.12RR138 pKa = 11.84AHH140 pKa = 6.5GGVDD144 pKa = 4.48FISYY148 pKa = 10.73SKK150 pKa = 11.02VFDD153 pKa = 5.15GILVTTGNPQGITGIDD169 pKa = 3.24TSLCGTTVALNKK181 pKa = 10.51GYY183 pKa = 11.09VEE185 pKa = 4.43VPLVEE190 pKa = 4.44ALVPEE195 pKa = 4.78CEE197 pKa = 4.21AAGLEE202 pKa = 4.22APTVSLFDD210 pKa = 3.8SSADD214 pKa = 3.46CVQAILAGRR223 pKa = 11.84ADD225 pKa = 3.81AYY227 pKa = 10.18INDD230 pKa = 3.59VNTVRR235 pKa = 11.84GYY237 pKa = 9.86VAQHH241 pKa = 6.96PDD243 pKa = 3.61DD244 pKa = 5.9LDD246 pKa = 3.66TAEE249 pKa = 4.61TVMLDD254 pKa = 3.38YY255 pKa = 11.0EE256 pKa = 4.21IGIGVLQGDD265 pKa = 3.91HH266 pKa = 7.04AFRR269 pKa = 11.84DD270 pKa = 4.02AVQAALVEE278 pKa = 4.37IQDD281 pKa = 4.5SGLQDD286 pKa = 3.39EE287 pKa = 5.46LAGKK291 pKa = 9.43WSLDD295 pKa = 3.5EE296 pKa = 4.23NALAEE301 pKa = 4.18PTVLSVGG308 pKa = 3.6
Molecular weight: 32.15 kDa
Isoelectric point according different methods:
Protein with the highest isoelectric point:
>tr|A0A1I3U6C6|A0A1I3U6C6_9CELL Amino acid ABC transporter ATP-binding protein PAAT family OS=Cellulomonas sp. KH9 OX=1855324 GN=SAMN05216467_0988 PE=4 SV=1
MM1 pKa = 7.4GSVIKK6 pKa = 10.42KK7 pKa = 8.47RR8 pKa = 11.84RR9 pKa = 11.84KK10 pKa = 9.22RR11 pKa = 11.84MAKK14 pKa = 9.41KK15 pKa = 9.87KK16 pKa = 9.7HH17 pKa = 5.84RR18 pKa = 11.84KK19 pKa = 8.56LLRR22 pKa = 11.84KK23 pKa = 7.78TRR25 pKa = 11.84HH26 pKa = 3.65QRR28 pKa = 11.84RR29 pKa = 11.84NKK31 pKa = 9.78KK32 pKa = 9.85
MM1 pKa = 7.4GSVIKK6 pKa = 10.42KK7 pKa = 8.47RR8 pKa = 11.84RR9 pKa = 11.84KK10 pKa = 9.22RR11 pKa = 11.84MAKK14 pKa = 9.41KK15 pKa = 9.87KK16 pKa = 9.7HH17 pKa = 5.84RR18 pKa = 11.84KK19 pKa = 8.56LLRR22 pKa = 11.84KK23 pKa = 7.78TRR25 pKa = 11.84HH26 pKa = 3.65QRR28 pKa = 11.84RR29 pKa = 11.84NKK31 pKa = 9.78KK32 pKa = 9.85
Molecular weight: 4.08 kDa
Isoelectric point according different methods:
Peptides (in silico digests for buttom-up proteomics)
Below you can find in silico digests of the whole proteome with Trypsin, Chymotrypsin, Trypsin+LysC, LysN, ArgC proteases suitable for different mass spec machines.| Try ESI |
 |
|---|
| ChTry ESI |
|
|---|
| ArgC ESI |
|
|---|
| LysN ESI |
|
|---|
| TryLysC ESI |
|
|---|
| Try MALDI |
|
|---|
| ChTry MALDI |
|
|---|
| ArgC MALDI |
|
|---|
| LysN MALDI |
|
|---|
| TryLysC MALDI |
|
|---|
| Try LTQ |
|
|---|
| ChTry LTQ |
|
|---|
| ArgC LTQ |
|
|---|
| LysN LTQ |
|
|---|
| TryLysC LTQ |
|
|---|
| Try MSlow |
|
|---|
| ChTry MSlow |
|
|---|
| ArgC MSlow |
|
|---|
| LysN MSlow |
|
|---|
| TryLysC MSlow |
|
|---|
| Try MShigh |
|
|---|
| ChTry MShigh |
|
|---|
| ArgC MShigh |
|
|---|
| LysN MShigh |
|
|---|
| TryLysC MShigh |
|
|---|
General Statistics
Number of major isoforms |
Number of additional isoforms |
Number of all proteins |
Number of amino acids |
Min. Seq. Length |
Max. Seq. Length |
Avg. Seq. Length |
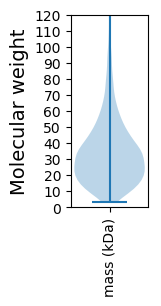
Avg. Mol. Weight |
|---|---|---|---|---|---|---|---|
0 |
1259060 |
29 |
2701 |
340.7 |
36.02 |
Amino acid frequency
Ala |
Cys |
Asp |
Glu |
Phe |
Gly |
His |
Ile |
Lys |
Leu |
|---|---|---|---|---|---|---|---|---|---|
14.711 ± 0.065 | 0.551 ± 0.009 |
6.681 ± 0.037 | 4.937 ± 0.034 |
2.346 ± 0.025 | 9.544 ± 0.04 |
2.144 ± 0.019 | 2.418 ± 0.029 |
1.169 ± 0.023 | 10.28 ± 0.05 |
Met |
Asn |
Gln |
Pro |
Arg |
Ser |
Thr |
Val |
Trp |
Tyr |
|---|---|---|---|---|---|---|---|---|---|
1.472 ± 0.015 | 1.355 ± 0.022 |
6.359 ± 0.035 | 2.656 ± 0.018 |
8.129 ± 0.049 | 4.513 ± 0.026 |
6.624 ± 0.044 | 10.747 ± 0.049 |
1.602 ± 0.018 | 1.763 ± 0.023 |
Most of the basic statistics you can see at this page can be downloaded from this CSV file
See this proteome in:

Proteome-pI is available under Creative Commons Attribution-NoDerivs license, for more details see here
| Reference: Kozlowski LP. Proteome-pI 2.0: Proteome Isoelectric Point Database Update. Nucleic Acids Res. 2021, doi: 10.1093/nar/gkab944 | Contact: Lukasz P. Kozlowski |