Eubacterium sp. CAG:180
Taxonomy: cellular organisms; Bacteria; Terrabacteria group; Firmicutes; Clostridia; Eubacteriales; Eubacteriaceae; Eubacterium; environmental samples
Average proteome isoelectric point is 6.24
Get precalculated fractions of proteins
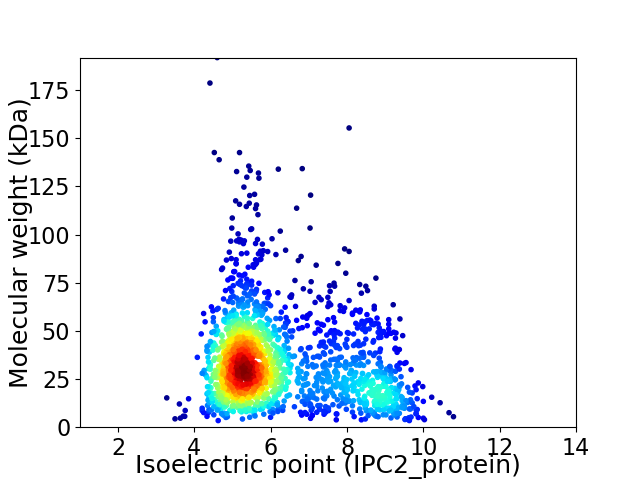
Virtual 2D-PAGE plot for 1742 proteins (isoelectric point calculated using IPC2_protein)
Get csv file with sequences according to given criteria:
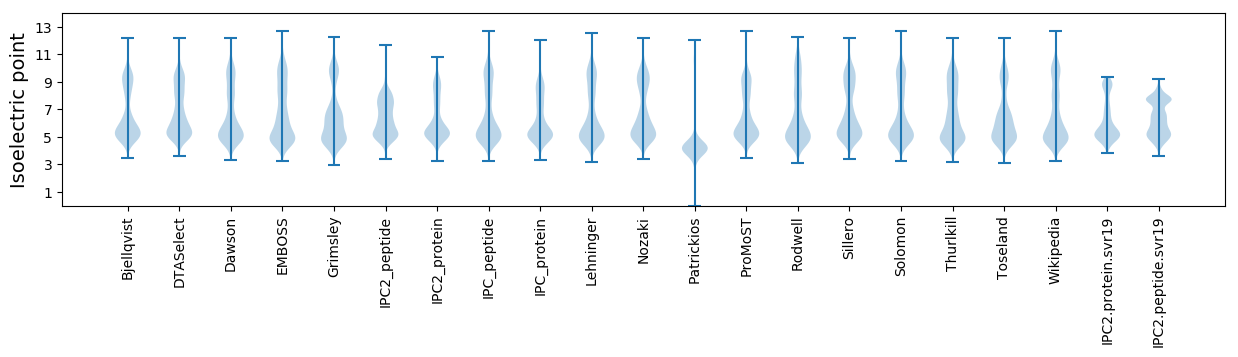
* You can choose from 21 different methods for calculating isoelectric point
Summary statistics related to proteome-wise predictions
Protein with the lowest isoelectric point:
>tr|R5MLY5|R5MLY5_9FIRM HPr kinase/phosphorylase OS=Eubacterium sp. CAG:180 OX=1262882 GN=hprK PE=3 SV=1
MM1 pKa = 7.53KK2 pKa = 10.16KK3 pKa = 9.99YY4 pKa = 10.46VCPCGYY10 pKa = 10.56VYY12 pKa = 10.77DD13 pKa = 4.46PAVGDD18 pKa = 4.12PDD20 pKa = 4.31NGVAPGTAWEE30 pKa = 4.87DD31 pKa = 3.67VPEE34 pKa = 4.42DD35 pKa = 3.74WVCPVCGLGKK45 pKa = 10.36DD46 pKa = 3.52SFTEE50 pKa = 3.76EE51 pKa = 4.22DD52 pKa = 3.19
MM1 pKa = 7.53KK2 pKa = 10.16KK3 pKa = 9.99YY4 pKa = 10.46VCPCGYY10 pKa = 10.56VYY12 pKa = 10.77DD13 pKa = 4.46PAVGDD18 pKa = 4.12PDD20 pKa = 4.31NGVAPGTAWEE30 pKa = 4.87DD31 pKa = 3.67VPEE34 pKa = 4.42DD35 pKa = 3.74WVCPVCGLGKK45 pKa = 10.36DD46 pKa = 3.52SFTEE50 pKa = 3.76EE51 pKa = 4.22DD52 pKa = 3.19
Molecular weight: 5.63 kDa
Isoelectric point according different methods:
Protein with the highest isoelectric point:
>tr|R5MJD1|R5MJD1_9FIRM D-isomer specific 2-hydroxyacid dehydrogenase NAD-binding protein OS=Eubacterium sp. CAG:180 OX=1262882 GN=BN519_01179 PE=3 SV=1
MM1 pKa = 7.57KK2 pKa = 9.98EE3 pKa = 3.77LAIKK7 pKa = 9.37MIRR10 pKa = 11.84FYY12 pKa = 10.49QRR14 pKa = 11.84KK15 pKa = 8.73ISPLFPPRR23 pKa = 11.84CRR25 pKa = 11.84YY26 pKa = 10.07YY27 pKa = 9.12PTCSQYY33 pKa = 11.64AVTAIEE39 pKa = 3.89RR40 pKa = 11.84FGIIRR45 pKa = 11.84GGLLAVWRR53 pKa = 11.84LLRR56 pKa = 11.84CNPLFPGGLDD66 pKa = 3.22PVPEE70 pKa = 4.14KK71 pKa = 10.77RR72 pKa = 11.84NKK74 pKa = 10.2KK75 pKa = 10.15KK76 pKa = 10.91GG77 pKa = 3.37
MM1 pKa = 7.57KK2 pKa = 9.98EE3 pKa = 3.77LAIKK7 pKa = 9.37MIRR10 pKa = 11.84FYY12 pKa = 10.49QRR14 pKa = 11.84KK15 pKa = 8.73ISPLFPPRR23 pKa = 11.84CRR25 pKa = 11.84YY26 pKa = 10.07YY27 pKa = 9.12PTCSQYY33 pKa = 11.64AVTAIEE39 pKa = 3.89RR40 pKa = 11.84FGIIRR45 pKa = 11.84GGLLAVWRR53 pKa = 11.84LLRR56 pKa = 11.84CNPLFPGGLDD66 pKa = 3.22PVPEE70 pKa = 4.14KK71 pKa = 10.77RR72 pKa = 11.84NKK74 pKa = 10.2KK75 pKa = 10.15KK76 pKa = 10.91GG77 pKa = 3.37
Molecular weight: 8.97 kDa
Isoelectric point according different methods:
Peptides (in silico digests for buttom-up proteomics)
Below you can find in silico digests of the whole proteome with Trypsin, Chymotrypsin, Trypsin+LysC, LysN, ArgC proteases suitable for different mass spec machines.| Try ESI |
 |
|---|
| ChTry ESI |
|
|---|
| ArgC ESI |
|
|---|
| LysN ESI |
|
|---|
| TryLysC ESI |
|
|---|
| Try MALDI |
|
|---|
| ChTry MALDI |
|
|---|
| ArgC MALDI |
|
|---|
| LysN MALDI |
|
|---|
| TryLysC MALDI |
|
|---|
| Try LTQ |
|
|---|
| ChTry LTQ |
|
|---|
| ArgC LTQ |
|
|---|
| LysN LTQ |
|
|---|
| TryLysC LTQ |
|
|---|
| Try MSlow |
|
|---|
| ChTry MSlow |
|
|---|
| ArgC MSlow |
|
|---|
| LysN MSlow |
|
|---|
| TryLysC MSlow |
|
|---|
| Try MShigh |
|
|---|
| ChTry MShigh |
|
|---|
| ArgC MShigh |
|
|---|
| LysN MShigh |
|
|---|
| TryLysC MShigh |
|
|---|
General Statistics
Number of major isoforms |
Number of additional isoforms |
Number of all proteins |
Number of amino acids |
Min. Seq. Length |
Max. Seq. Length |
Avg. Seq. Length |
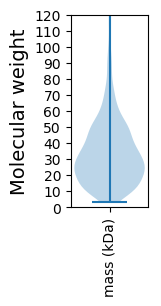
Avg. Mol. Weight |
|---|---|---|---|---|---|---|---|
0 |
551212 |
29 |
1757 |
316.4 |
35.14 |
Amino acid frequency
Ala |
Cys |
Asp |
Glu |
Phe |
Gly |
His |
Ile |
Lys |
Leu |
|---|---|---|---|---|---|---|---|---|---|
7.813 ± 0.055 | 1.698 ± 0.026 |
6.174 ± 0.048 | 6.673 ± 0.055 |
4.326 ± 0.038 | 7.196 ± 0.053 |
1.537 ± 0.023 | 7.276 ± 0.046 |
7.693 ± 0.047 | 8.606 ± 0.058 |
Met |
Asn |
Gln |
Pro |
Arg |
Ser |
Thr |
Val |
Trp |
Tyr |
|---|---|---|---|---|---|---|---|---|---|
2.705 ± 0.026 | 4.68 ± 0.037 |
3.415 ± 0.033 | 2.142 ± 0.028 |
4.061 ± 0.04 | 6.643 ± 0.05 |
5.535 ± 0.043 | 7.13 ± 0.044 |
0.727 ± 0.021 | 3.969 ± 0.041 |
Most of the basic statistics you can see at this page can be downloaded from this CSV file
See this proteome in:

Proteome-pI is available under Creative Commons Attribution-NoDerivs license, for more details see here
| Reference: Kozlowski LP. Proteome-pI 2.0: Proteome Isoelectric Point Database Update. Nucleic Acids Res. 2021, doi: 10.1093/nar/gkab944 | Contact: Lukasz P. Kozlowski |