Klebsiella phage SJM3
Taxonomy: Viruses; Duplodnaviria; Heunggongvirae; Uroviricota; Caudoviricetes; Caudovirales; Podoviridae; Lastavirus; unclassified Lastavirus
Average proteome isoelectric point is 6.78
Get precalculated fractions of proteins
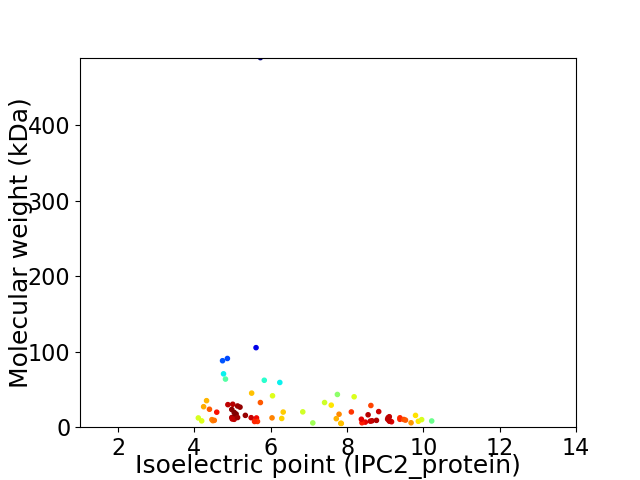
Virtual 2D-PAGE plot for 76 proteins (isoelectric point calculated using IPC2_protein)
Get csv file with sequences according to given criteria:
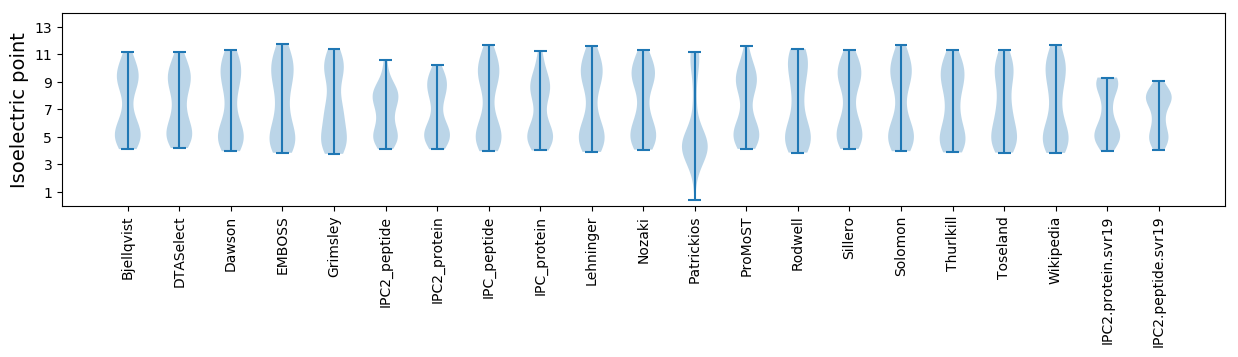
* You can choose from 21 different methods for calculating isoelectric point
Summary statistics related to proteome-wise predictions
Protein with the lowest isoelectric point:
>tr|A0A6H0X3K6|A0A6H0X3K6_9CAUD Uncharacterized protein OS=Klebsiella phage SJM3 OX=2723759 GN=24147SJM3_00028 PE=4 SV=1
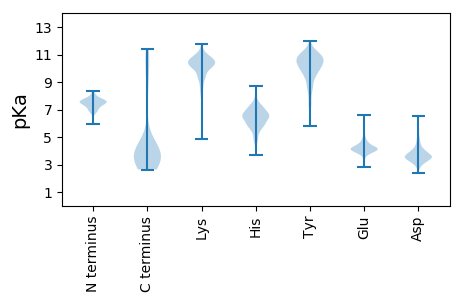
MM1 pKa = 6.89ITIPVTGYY9 pKa = 11.08AIVLACSINAGTPDD23 pKa = 5.28CIEE26 pKa = 3.97QLATGYY32 pKa = 10.03VWANAQRR39 pKa = 11.84CQEE42 pKa = 4.24EE43 pKa = 4.58LDD45 pKa = 3.59HH46 pKa = 7.01AKK48 pKa = 10.22IPGAQCEE55 pKa = 4.48SLSGITVSDD64 pKa = 4.05EE65 pKa = 4.22GTGPALARR73 pKa = 11.84MIDD76 pKa = 3.63VEE78 pKa = 4.68GMM80 pKa = 3.32
MM1 pKa = 6.89ITIPVTGYY9 pKa = 11.08AIVLACSINAGTPDD23 pKa = 5.28CIEE26 pKa = 3.97QLATGYY32 pKa = 10.03VWANAQRR39 pKa = 11.84CQEE42 pKa = 4.24EE43 pKa = 4.58LDD45 pKa = 3.59HH46 pKa = 7.01AKK48 pKa = 10.22IPGAQCEE55 pKa = 4.48SLSGITVSDD64 pKa = 4.05EE65 pKa = 4.22GTGPALARR73 pKa = 11.84MIDD76 pKa = 3.63VEE78 pKa = 4.68GMM80 pKa = 3.32
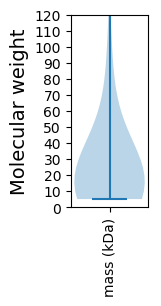
Molecular weight: 8.37 kDa
Isoelectric point according different methods:
Protein with the highest isoelectric point:
>tr|A0A6H0X3Q2|A0A6H0X3Q2_9CAUD Transcriptional regulator OS=Klebsiella phage SJM3 OX=2723759 GN=24147SJM3_00050 PE=4 SV=1
MM1 pKa = 7.83PKK3 pKa = 10.06LPSVFPIIHH12 pKa = 6.87DD13 pKa = 3.93HH14 pKa = 5.66GTDD17 pKa = 2.93AKK19 pKa = 10.75GAEE22 pKa = 4.25RR23 pKa = 11.84HH24 pKa = 6.11CLSLVKK30 pKa = 10.66GGWSAKK36 pKa = 8.95LVRR39 pKa = 11.84PAGRR43 pKa = 11.84GWRR46 pKa = 11.84VVISGYY52 pKa = 10.37RR53 pKa = 11.84GG54 pKa = 2.97
MM1 pKa = 7.83PKK3 pKa = 10.06LPSVFPIIHH12 pKa = 6.87DD13 pKa = 3.93HH14 pKa = 5.66GTDD17 pKa = 2.93AKK19 pKa = 10.75GAEE22 pKa = 4.25RR23 pKa = 11.84HH24 pKa = 6.11CLSLVKK30 pKa = 10.66GGWSAKK36 pKa = 8.95LVRR39 pKa = 11.84PAGRR43 pKa = 11.84GWRR46 pKa = 11.84VVISGYY52 pKa = 10.37RR53 pKa = 11.84GG54 pKa = 2.97
Molecular weight: 5.87 kDa
Isoelectric point according different methods:
Peptides (in silico digests for buttom-up proteomics)
Below you can find in silico digests of the whole proteome with Trypsin, Chymotrypsin, Trypsin+LysC, LysN, ArgC proteases suitable for different mass spec machines.| Try ESI |
 |
|---|
| ChTry ESI |
|
|---|
| ArgC ESI |
|
|---|
| LysN ESI |
|
|---|
| TryLysC ESI |
|
|---|
| Try MALDI |
|
|---|
| ChTry MALDI |
|
|---|
| ArgC MALDI |
|
|---|
| LysN MALDI |
|
|---|
| TryLysC MALDI |
|
|---|
| Try LTQ |
|
|---|
| ChTry LTQ |
|
|---|
| ArgC LTQ |
|
|---|
| LysN LTQ |
|
|---|
| TryLysC LTQ |
|
|---|
| Try MSlow |
|
|---|
| ChTry MSlow |
|
|---|
| ArgC MSlow |
|
|---|
| LysN MSlow |
|
|---|
| TryLysC MSlow |
|
|---|
| Try MShigh |
|
|---|
| ChTry MShigh |
|
|---|
| ArgC MShigh |
|
|---|
| LysN MShigh |
|
|---|
| TryLysC MShigh |
|
|---|
General Statistics
Number of major isoforms |
Number of additional isoforms |
Number of all proteins |
Number of amino acids |
Min. Seq. Length |
Max. Seq. Length |
Avg. Seq. Length |
Avg. Mol. Weight |
|---|---|---|---|---|---|---|---|
0 |
19345 |
46 |
4433 |
254.5 |
28.25 |
Amino acid frequency
Ala |
Cys |
Asp |
Glu |
Phe |
Gly |
His |
Ile |
Lys |
Leu |
|---|---|---|---|---|---|---|---|---|---|
10.607 ± 0.376 | 0.889 ± 0.235 |
6.043 ± 0.188 | 7.092 ± 0.371 |
3.158 ± 0.182 | 7.651 ± 0.256 |
1.716 ± 0.163 | 5.025 ± 0.222 |
5.428 ± 0.338 | 7.382 ± 0.231 |
Met |
Asn |
Gln |
Pro |
Arg |
Ser |
Thr |
Val |
Trp |
Tyr |
|---|---|---|---|---|---|---|---|---|---|
2.683 ± 0.143 | 4.042 ± 0.217 |
4.797 ± 0.166 | 5.056 ± 0.374 |
6.477 ± 0.325 | 5.774 ± 0.237 |
5.609 ± 0.194 | 5.857 ± 0.252 |
1.747 ± 0.207 | 2.967 ± 0.164 |
Most of the basic statistics you can see at this page can be downloaded from this CSV file
See this proteome in:

Proteome-pI is available under Creative Commons Attribution-NoDerivs license, for more details see here
| Reference: Kozlowski LP. Proteome-pI 2.0: Proteome Isoelectric Point Database Update. Nucleic Acids Res. 2021, doi: 10.1093/nar/gkab944 | Contact: Lukasz P. Kozlowski |