Limimonas halophila
Taxonomy: cellular organisms; Bacteria; Proteobacteria; Alphaproteobacteria; Hyphomicrobiales; Rhodovibrionaceae; Limimonas
Average proteome isoelectric point is 6.33
Get precalculated fractions of proteins
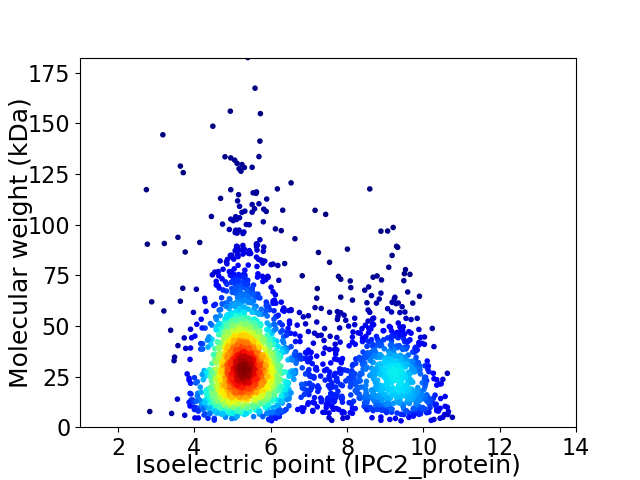
Virtual 2D-PAGE plot for 2820 proteins (isoelectric point calculated using IPC2_protein)
Get csv file with sequences according to given criteria:
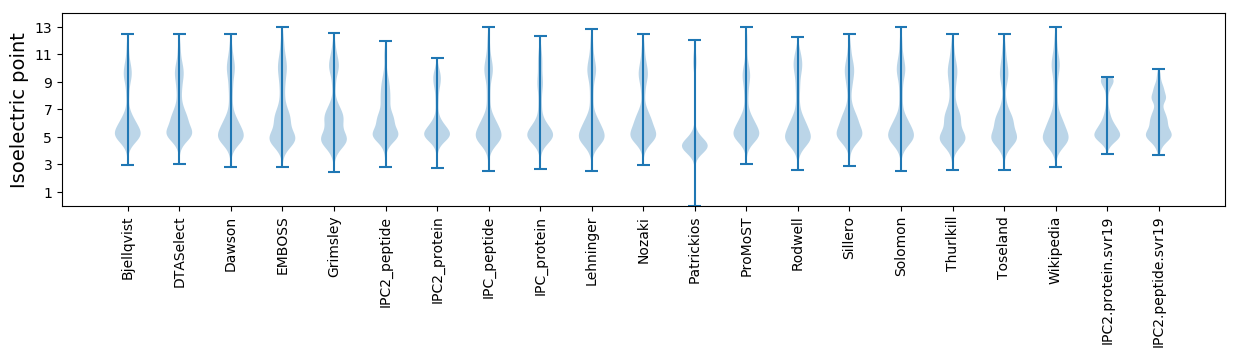
* You can choose from 21 different methods for calculating isoelectric point
Summary statistics related to proteome-wise predictions
Protein with the lowest isoelectric point:
>tr|A0A1G7SQA1|A0A1G7SQA1_9PROT Helicase conserved C-terminal domain-containing protein OS=Limimonas halophila OX=1082479 GN=SAMN05216241_107107 PE=4 SV=1
MM1 pKa = 7.24TMKK4 pKa = 10.52KK5 pKa = 10.09SLYY8 pKa = 9.58ATTALLGVATVANGAHH24 pKa = 6.58AEE26 pKa = 4.53GINLDD31 pKa = 3.33VGGFFNFYY39 pKa = 10.54QSVGDD44 pKa = 3.5PHH46 pKa = 8.45GGFGVDD52 pKa = 3.94DD53 pKa = 3.84TQTFQDD59 pKa = 3.9AEE61 pKa = 4.13ISFSGSYY68 pKa = 9.34TLDD71 pKa = 3.14NGIEE75 pKa = 4.07AGVSITTEE83 pKa = 3.48IANPNSDD90 pKa = 3.35FQQGVEE96 pKa = 3.73ADD98 pKa = 3.55GVYY101 pKa = 10.99GYY103 pKa = 9.8MKK105 pKa = 10.59GSFGTVQLGSQNSAAYY121 pKa = 8.53AQSWGAGPLWSYY133 pKa = 9.46TLVPINTGWQSYY145 pKa = 7.11FTGGTSANAGNFYY158 pKa = 10.99NVGGSTHH165 pKa = 7.21LDD167 pKa = 3.54FANDD171 pKa = 3.58AQRR174 pKa = 11.84IAYY177 pKa = 6.54YY178 pKa = 8.13TPRR181 pKa = 11.84VAGFKK186 pKa = 10.41FGASWAPEE194 pKa = 3.58IQGNNTQQFGFQDD207 pKa = 3.7SDD209 pKa = 3.57TTASDD214 pKa = 3.67GLSASVSWSQDD225 pKa = 3.0FQQVGLSAYY234 pKa = 10.19AGVNTAQAADD244 pKa = 3.68GSGNEE249 pKa = 4.22DD250 pKa = 3.7PEE252 pKa = 5.66HH253 pKa = 7.16YY254 pKa = 9.39MAGVRR259 pKa = 11.84ANFAGFGVGYY269 pKa = 10.82AFAEE273 pKa = 4.33ADD275 pKa = 3.61NPDD278 pKa = 3.95AVSAAQGDD286 pKa = 4.19SPDD289 pKa = 4.02DD290 pKa = 3.8GRR292 pKa = 11.84AHH294 pKa = 6.65GFDD297 pKa = 3.54VVYY300 pKa = 9.71STGPFTFQAEE310 pKa = 4.2ALISRR315 pKa = 11.84TDD317 pKa = 3.62GNSATPDD324 pKa = 3.59ADD326 pKa = 3.3QEE328 pKa = 4.74TYY330 pKa = 10.62KK331 pKa = 11.16GAVGYY336 pKa = 10.51NLGPGINLSGGVIFDD351 pKa = 3.73NQEE354 pKa = 3.49NNAGVDD360 pKa = 3.42SDD362 pKa = 4.28AVSGVIGTTMFFF374 pKa = 3.68
MM1 pKa = 7.24TMKK4 pKa = 10.52KK5 pKa = 10.09SLYY8 pKa = 9.58ATTALLGVATVANGAHH24 pKa = 6.58AEE26 pKa = 4.53GINLDD31 pKa = 3.33VGGFFNFYY39 pKa = 10.54QSVGDD44 pKa = 3.5PHH46 pKa = 8.45GGFGVDD52 pKa = 3.94DD53 pKa = 3.84TQTFQDD59 pKa = 3.9AEE61 pKa = 4.13ISFSGSYY68 pKa = 9.34TLDD71 pKa = 3.14NGIEE75 pKa = 4.07AGVSITTEE83 pKa = 3.48IANPNSDD90 pKa = 3.35FQQGVEE96 pKa = 3.73ADD98 pKa = 3.55GVYY101 pKa = 10.99GYY103 pKa = 9.8MKK105 pKa = 10.59GSFGTVQLGSQNSAAYY121 pKa = 8.53AQSWGAGPLWSYY133 pKa = 9.46TLVPINTGWQSYY145 pKa = 7.11FTGGTSANAGNFYY158 pKa = 10.99NVGGSTHH165 pKa = 7.21LDD167 pKa = 3.54FANDD171 pKa = 3.58AQRR174 pKa = 11.84IAYY177 pKa = 6.54YY178 pKa = 8.13TPRR181 pKa = 11.84VAGFKK186 pKa = 10.41FGASWAPEE194 pKa = 3.58IQGNNTQQFGFQDD207 pKa = 3.7SDD209 pKa = 3.57TTASDD214 pKa = 3.67GLSASVSWSQDD225 pKa = 3.0FQQVGLSAYY234 pKa = 10.19AGVNTAQAADD244 pKa = 3.68GSGNEE249 pKa = 4.22DD250 pKa = 3.7PEE252 pKa = 5.66HH253 pKa = 7.16YY254 pKa = 9.39MAGVRR259 pKa = 11.84ANFAGFGVGYY269 pKa = 10.82AFAEE273 pKa = 4.33ADD275 pKa = 3.61NPDD278 pKa = 3.95AVSAAQGDD286 pKa = 4.19SPDD289 pKa = 4.02DD290 pKa = 3.8GRR292 pKa = 11.84AHH294 pKa = 6.65GFDD297 pKa = 3.54VVYY300 pKa = 9.71STGPFTFQAEE310 pKa = 4.2ALISRR315 pKa = 11.84TDD317 pKa = 3.62GNSATPDD324 pKa = 3.59ADD326 pKa = 3.3QEE328 pKa = 4.74TYY330 pKa = 10.62KK331 pKa = 11.16GAVGYY336 pKa = 10.51NLGPGINLSGGVIFDD351 pKa = 3.73NQEE354 pKa = 3.49NNAGVDD360 pKa = 3.42SDD362 pKa = 4.28AVSGVIGTTMFFF374 pKa = 3.68
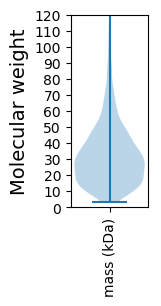
Molecular weight: 38.89 kDa
Isoelectric point according different methods:
Protein with the highest isoelectric point:
>tr|A0A1G7L6K9|A0A1G7L6K9_9PROT Uncharacterized protein OS=Limimonas halophila OX=1082479 GN=SAMN05216241_101140 PE=4 SV=1
MM1 pKa = 7.53KK2 pKa = 10.21RR3 pKa = 11.84RR4 pKa = 11.84RR5 pKa = 11.84HH6 pKa = 4.98ANRR9 pKa = 11.84TKK11 pKa = 10.77AHH13 pKa = 6.47RR14 pKa = 11.84LSARR18 pKa = 11.84GHH20 pKa = 6.29RR21 pKa = 11.84KK22 pKa = 6.89QTPPKK27 pKa = 9.8QKK29 pKa = 10.31GQIFFTGGKK38 pKa = 9.6CRR40 pKa = 11.84FF41 pKa = 3.66
MM1 pKa = 7.53KK2 pKa = 10.21RR3 pKa = 11.84RR4 pKa = 11.84RR5 pKa = 11.84HH6 pKa = 4.98ANRR9 pKa = 11.84TKK11 pKa = 10.77AHH13 pKa = 6.47RR14 pKa = 11.84LSARR18 pKa = 11.84GHH20 pKa = 6.29RR21 pKa = 11.84KK22 pKa = 6.89QTPPKK27 pKa = 9.8QKK29 pKa = 10.31GQIFFTGGKK38 pKa = 9.6CRR40 pKa = 11.84FF41 pKa = 3.66
Molecular weight: 4.87 kDa
Isoelectric point according different methods:
Peptides (in silico digests for buttom-up proteomics)
Below you can find in silico digests of the whole proteome with Trypsin, Chymotrypsin, Trypsin+LysC, LysN, ArgC proteases suitable for different mass spec machines.| Try ESI |
 |
|---|
| ChTry ESI |
|
|---|
| ArgC ESI |
|
|---|
| LysN ESI |
|
|---|
| TryLysC ESI |
|
|---|
| Try MALDI |
|
|---|
| ChTry MALDI |
|
|---|
| ArgC MALDI |
|
|---|
| LysN MALDI |
|
|---|
| TryLysC MALDI |
|
|---|
| Try LTQ |
|
|---|
| ChTry LTQ |
|
|---|
| ArgC LTQ |
|
|---|
| LysN LTQ |
|
|---|
| TryLysC LTQ |
|
|---|
| Try MSlow |
|
|---|
| ChTry MSlow |
|
|---|
| ArgC MSlow |
|
|---|
| LysN MSlow |
|
|---|
| TryLysC MSlow |
|
|---|
| Try MShigh |
|
|---|
| ChTry MShigh |
|
|---|
| ArgC MShigh |
|
|---|
| LysN MShigh |
|
|---|
| TryLysC MShigh |
|
|---|
General Statistics
Number of major isoforms |
Number of additional isoforms |
Number of all proteins |
Number of amino acids |
Min. Seq. Length |
Max. Seq. Length |
Avg. Seq. Length |
Avg. Mol. Weight |
|---|---|---|---|---|---|---|---|
0 |
886467 |
28 |
1626 |
314.4 |
34.0 |
Amino acid frequency
Ala |
Cys |
Asp |
Glu |
Phe |
Gly |
His |
Ile |
Lys |
Leu |
|---|---|---|---|---|---|---|---|---|---|
13.287 ± 0.082 | 0.796 ± 0.015 |
6.261 ± 0.043 | 6.208 ± 0.04 |
3.08 ± 0.028 | 8.931 ± 0.048 |
2.351 ± 0.024 | 3.964 ± 0.027 |
2.49 ± 0.033 | 9.718 ± 0.056 |
Met |
Asn |
Gln |
Pro |
Arg |
Ser |
Thr |
Val |
Trp |
Tyr |
|---|---|---|---|---|---|---|---|---|---|
2.246 ± 0.02 | 2.407 ± 0.031 |
5.328 ± 0.035 | 3.393 ± 0.031 |
8.064 ± 0.057 | 4.538 ± 0.034 |
5.727 ± 0.038 | 7.891 ± 0.038 |
1.252 ± 0.019 | 2.067 ± 0.024 |
Most of the basic statistics you can see at this page can be downloaded from this CSV file
See this proteome in:

Proteome-pI is available under Creative Commons Attribution-NoDerivs license, for more details see here
| Reference: Kozlowski LP. Proteome-pI 2.0: Proteome Isoelectric Point Database Update. Nucleic Acids Res. 2021, doi: 10.1093/nar/gkab944 | Contact: Lukasz P. Kozlowski |