Hydrogenobacter sp. T-8
Taxonomy: cellular organisms; Bacteria; Aquificae; Aquificae; Aquificales; Aquificaceae; Hydrogenobacter; unclassified Hydrogenobacter
Average proteome isoelectric point is 6.86
Get precalculated fractions of proteins
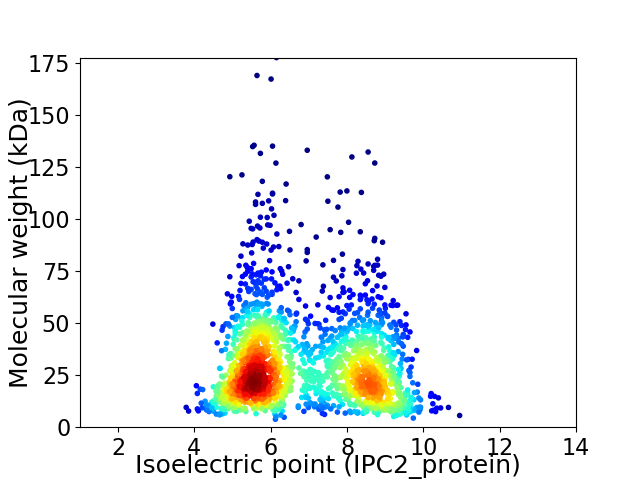
Virtual 2D-PAGE plot for 2006 proteins (isoelectric point calculated using IPC2_protein)
Get csv file with sequences according to given criteria:
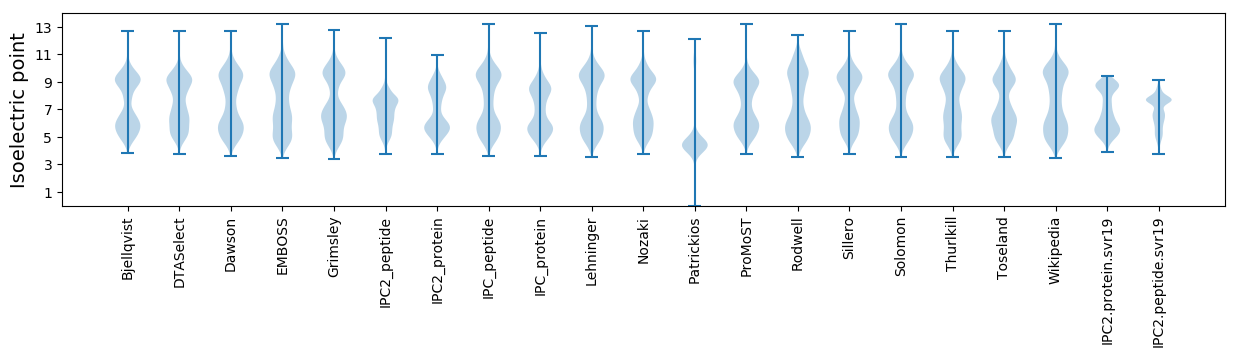
* You can choose from 21 different methods for calculating isoelectric point
Summary statistics related to proteome-wise predictions
Protein with the lowest isoelectric point:
>tr|A0A6C1BPB5|A0A6C1BPB5_9AQUI Uma2 family endonuclease OS=Hydrogenobacter sp. T-8 OX=1632019 GN=G3M65_01435 PE=4 SV=1
MM1 pKa = 8.3IYY3 pKa = 8.64ITKK6 pKa = 10.37QGDD9 pKa = 3.07RR10 pKa = 11.84WDD12 pKa = 4.12TIAYY16 pKa = 9.02KK17 pKa = 10.73LYY19 pKa = 9.82GDD21 pKa = 4.73PYY23 pKa = 11.16AYY25 pKa = 9.77DD26 pKa = 4.43ALLLYY31 pKa = 10.02NPQYY35 pKa = 11.4AGITVFPAGIQLVVPEE51 pKa = 4.94IEE53 pKa = 4.11YY54 pKa = 11.05EE55 pKa = 4.44DD56 pKa = 3.82INEE59 pKa = 4.44VSPPWQTDD67 pKa = 2.64
MM1 pKa = 8.3IYY3 pKa = 8.64ITKK6 pKa = 10.37QGDD9 pKa = 3.07RR10 pKa = 11.84WDD12 pKa = 4.12TIAYY16 pKa = 9.02KK17 pKa = 10.73LYY19 pKa = 9.82GDD21 pKa = 4.73PYY23 pKa = 11.16AYY25 pKa = 9.77DD26 pKa = 4.43ALLLYY31 pKa = 10.02NPQYY35 pKa = 11.4AGITVFPAGIQLVVPEE51 pKa = 4.94IEE53 pKa = 4.11YY54 pKa = 11.05EE55 pKa = 4.44DD56 pKa = 3.82INEE59 pKa = 4.44VSPPWQTDD67 pKa = 2.64
Molecular weight: 7.75 kDa
Isoelectric point according different methods:
Protein with the highest isoelectric point:
>tr|A0A6C1BVT4|A0A6C1BVT4_9AQUI Uncharacterized protein OS=Hydrogenobacter sp. T-8 OX=1632019 GN=G3M65_09055 PE=4 SV=1
MM1 pKa = 7.24ATQRR5 pKa = 11.84NITRR9 pKa = 11.84ISNLRR14 pKa = 11.84RR15 pKa = 11.84KK16 pKa = 9.7RR17 pKa = 11.84KK18 pKa = 9.73SGFLARR24 pKa = 11.84MEE26 pKa = 4.53TKK28 pKa = 10.22SGRR31 pKa = 11.84AIIKK35 pKa = 9.84RR36 pKa = 11.84RR37 pKa = 11.84RR38 pKa = 11.84QKK40 pKa = 10.17GRR42 pKa = 11.84KK43 pKa = 9.01RR44 pKa = 11.84LTPP47 pKa = 3.95
MM1 pKa = 7.24ATQRR5 pKa = 11.84NITRR9 pKa = 11.84ISNLRR14 pKa = 11.84RR15 pKa = 11.84KK16 pKa = 9.7RR17 pKa = 11.84KK18 pKa = 9.73SGFLARR24 pKa = 11.84MEE26 pKa = 4.53TKK28 pKa = 10.22SGRR31 pKa = 11.84AIIKK35 pKa = 9.84RR36 pKa = 11.84RR37 pKa = 11.84RR38 pKa = 11.84QKK40 pKa = 10.17GRR42 pKa = 11.84KK43 pKa = 9.01RR44 pKa = 11.84LTPP47 pKa = 3.95
Molecular weight: 5.62 kDa
Isoelectric point according different methods:
Peptides (in silico digests for buttom-up proteomics)
Below you can find in silico digests of the whole proteome with Trypsin, Chymotrypsin, Trypsin+LysC, LysN, ArgC proteases suitable for different mass spec machines.| Try ESI |
 |
|---|
| ChTry ESI |
|
|---|
| ArgC ESI |
|
|---|
| LysN ESI |
|
|---|
| TryLysC ESI |
|
|---|
| Try MALDI |
|
|---|
| ChTry MALDI |
|
|---|
| ArgC MALDI |
|
|---|
| LysN MALDI |
|
|---|
| TryLysC MALDI |
|
|---|
| Try LTQ |
|
|---|
| ChTry LTQ |
|
|---|
| ArgC LTQ |
|
|---|
| LysN LTQ |
|
|---|
| TryLysC LTQ |
|
|---|
| Try MSlow |
|
|---|
| ChTry MSlow |
|
|---|
| ArgC MSlow |
|
|---|
| LysN MSlow |
|
|---|
| TryLysC MSlow |
|
|---|
| Try MShigh |
|
|---|
| ChTry MShigh |
|
|---|
| ArgC MShigh |
|
|---|
| LysN MShigh |
|
|---|
| TryLysC MShigh |
|
|---|
General Statistics
Number of major isoforms |
Number of additional isoforms |
Number of all proteins |
Number of amino acids |
Min. Seq. Length |
Max. Seq. Length |
Avg. Seq. Length |
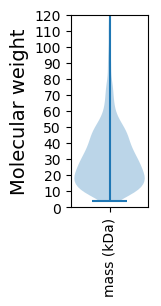
Avg. Mol. Weight |
|---|---|---|---|---|---|---|---|
0 |
571723 |
36 |
1565 |
285.0 |
32.44 |
Amino acid frequency
Ala |
Cys |
Asp |
Glu |
Phe |
Gly |
His |
Ile |
Lys |
Leu |
|---|---|---|---|---|---|---|---|---|---|
6.172 ± 0.045 | 0.953 ± 0.023 |
4.526 ± 0.034 | 8.766 ± 0.078 |
4.818 ± 0.05 | 6.987 ± 0.053 |
1.717 ± 0.021 | 6.65 ± 0.035 |
7.361 ± 0.05 | 11.495 ± 0.086 |
Met |
Asn |
Gln |
Pro |
Arg |
Ser |
Thr |
Val |
Trp |
Tyr |
|---|---|---|---|---|---|---|---|---|---|
2.259 ± 0.02 | 3.068 ± 0.035 |
4.078 ± 0.043 | 2.707 ± 0.029 |
6.018 ± 0.04 | 5.625 ± 0.041 |
3.977 ± 0.036 | 7.677 ± 0.055 |
1.067 ± 0.02 | 4.08 ± 0.035 |
Most of the basic statistics you can see at this page can be downloaded from this CSV file
See this proteome in:

Proteome-pI is available under Creative Commons Attribution-NoDerivs license, for more details see here
| Reference: Kozlowski LP. Proteome-pI 2.0: Proteome Isoelectric Point Database Update. Nucleic Acids Res. 2021, doi: 10.1093/nar/gkab944 | Contact: Lukasz P. Kozlowski |