Altererythrobacter xiamenensis
Taxonomy: cellular organisms; Bacteria; Proteobacteria; Alphaproteobacteria; Sphingomonadales; Erythrobacteraceae; Altererythrobacter
Average proteome isoelectric point is 5.8
Get precalculated fractions of proteins
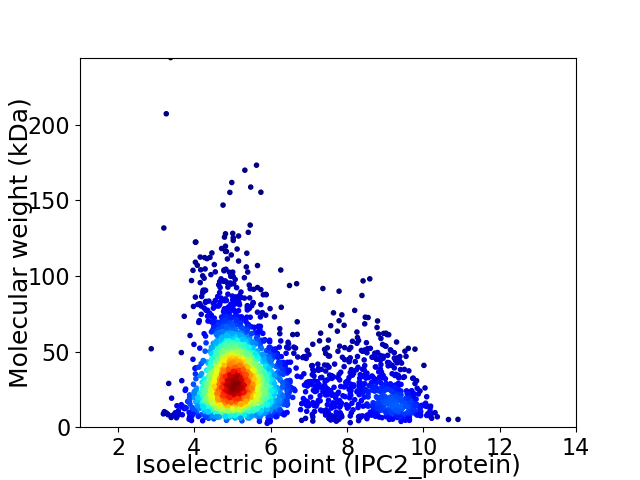
Virtual 2D-PAGE plot for 2951 proteins (isoelectric point calculated using IPC2_protein)
Get csv file with sequences according to given criteria:
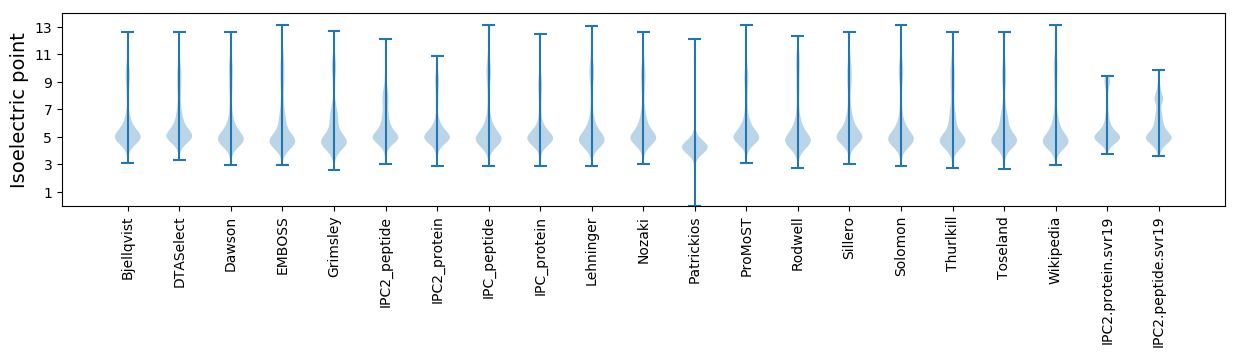
* You can choose from 21 different methods for calculating isoelectric point
Summary statistics related to proteome-wise predictions
Protein with the lowest isoelectric point:
>tr|A0A1Y6EKA2|A0A1Y6EKA2_9SPHN PAP2 superfamily protein OS=Altererythrobacter xiamenensis OX=1316679 GN=SAMN06297468_0444 PE=4 SV=1
MM1 pKa = 7.07VPARR5 pKa = 11.84LTEE8 pKa = 4.17TLNMNTPKK16 pKa = 9.86IDD18 pKa = 3.69LASLPGLDD26 pKa = 3.3TVTGIFGSTAQAGAAYY42 pKa = 9.93DD43 pKa = 4.05DD44 pKa = 4.1GVVAIMVYY52 pKa = 10.41VYY54 pKa = 11.07DD55 pKa = 4.07VVPPSAIVV63 pKa = 2.98
MM1 pKa = 7.07VPARR5 pKa = 11.84LTEE8 pKa = 4.17TLNMNTPKK16 pKa = 9.86IDD18 pKa = 3.69LASLPGLDD26 pKa = 3.3TVTGIFGSTAQAGAAYY42 pKa = 9.93DD43 pKa = 4.05DD44 pKa = 4.1GVVAIMVYY52 pKa = 10.41VYY54 pKa = 11.07DD55 pKa = 4.07VVPPSAIVV63 pKa = 2.98
Molecular weight: 6.51 kDa
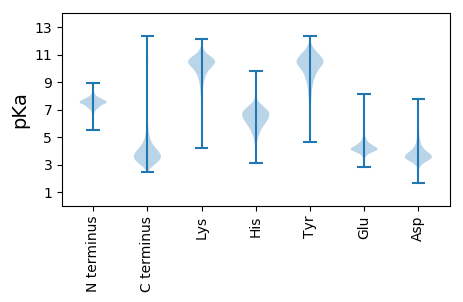
Isoelectric point according different methods:
Protein with the highest isoelectric point:
>tr|A0A1Y6F3N6|A0A1Y6F3N6_9SPHN Cupin domain protein OS=Altererythrobacter xiamenensis OX=1316679 GN=SAMN06297468_1681 PE=4 SV=1
MM1 pKa = 7.45KK2 pKa = 9.61RR3 pKa = 11.84TFQPSNLVRR12 pKa = 11.84ARR14 pKa = 11.84RR15 pKa = 11.84HH16 pKa = 4.89GFFARR21 pKa = 11.84KK22 pKa = 8.1ATTGGRR28 pKa = 11.84KK29 pKa = 8.12VLRR32 pKa = 11.84ARR34 pKa = 11.84RR35 pKa = 11.84KK36 pKa = 8.68RR37 pKa = 11.84GRR39 pKa = 11.84KK40 pKa = 8.82KK41 pKa = 10.45LCAA44 pKa = 3.96
MM1 pKa = 7.45KK2 pKa = 9.61RR3 pKa = 11.84TFQPSNLVRR12 pKa = 11.84ARR14 pKa = 11.84RR15 pKa = 11.84HH16 pKa = 4.89GFFARR21 pKa = 11.84KK22 pKa = 8.1ATTGGRR28 pKa = 11.84KK29 pKa = 8.12VLRR32 pKa = 11.84ARR34 pKa = 11.84RR35 pKa = 11.84KK36 pKa = 8.68RR37 pKa = 11.84GRR39 pKa = 11.84KK40 pKa = 8.82KK41 pKa = 10.45LCAA44 pKa = 3.96
Molecular weight: 5.17 kDa
Isoelectric point according different methods:
Peptides (in silico digests for buttom-up proteomics)
Below you can find in silico digests of the whole proteome with Trypsin, Chymotrypsin, Trypsin+LysC, LysN, ArgC proteases suitable for different mass spec machines.| Try ESI |
 |
|---|
| ChTry ESI |
|
|---|
| ArgC ESI |
|
|---|
| LysN ESI |
|
|---|
| TryLysC ESI |
|
|---|
| Try MALDI |
|
|---|
| ChTry MALDI |
|
|---|
| ArgC MALDI |
|
|---|
| LysN MALDI |
|
|---|
| TryLysC MALDI |
|
|---|
| Try LTQ |
|
|---|
| ChTry LTQ |
|
|---|
| ArgC LTQ |
|
|---|
| LysN LTQ |
|
|---|
| TryLysC LTQ |
|
|---|
| Try MSlow |
|
|---|
| ChTry MSlow |
|
|---|
| ArgC MSlow |
|
|---|
| LysN MSlow |
|
|---|
| TryLysC MSlow |
|
|---|
| Try MShigh |
|
|---|
| ChTry MShigh |
|
|---|
| ArgC MShigh |
|
|---|
| LysN MShigh |
|
|---|
| TryLysC MShigh |
|
|---|
General Statistics
Number of major isoforms |
Number of additional isoforms |
Number of all proteins |
Number of amino acids |
Min. Seq. Length |
Max. Seq. Length |
Avg. Seq. Length |
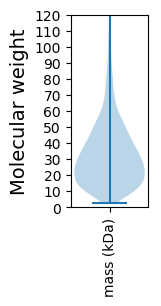
Avg. Mol. Weight |
|---|---|---|---|---|---|---|---|
0 |
930223 |
28 |
2332 |
315.2 |
34.31 |
Amino acid frequency
Ala |
Cys |
Asp |
Glu |
Phe |
Gly |
His |
Ile |
Lys |
Leu |
|---|---|---|---|---|---|---|---|---|---|
11.993 ± 0.059 | 0.799 ± 0.014 |
6.247 ± 0.041 | 6.92 ± 0.048 |
3.745 ± 0.03 | 8.734 ± 0.049 |
1.916 ± 0.023 | 5.223 ± 0.028 |
3.415 ± 0.036 | 9.555 ± 0.054 |
Met |
Asn |
Gln |
Pro |
Arg |
Ser |
Thr |
Val |
Trp |
Tyr |
|---|---|---|---|---|---|---|---|---|---|
2.573 ± 0.025 | 2.774 ± 0.031 |
4.997 ± 0.026 | 3.186 ± 0.021 |
6.69 ± 0.039 | 5.528 ± 0.033 |
5.166 ± 0.035 | 6.85 ± 0.039 |
1.432 ± 0.019 | 2.257 ± 0.023 |
Most of the basic statistics you can see at this page can be downloaded from this CSV file
See this proteome in:

Proteome-pI is available under Creative Commons Attribution-NoDerivs license, for more details see here
| Reference: Kozlowski LP. Proteome-pI 2.0: Proteome Isoelectric Point Database Update. Nucleic Acids Res. 2021, doi: 10.1093/nar/gkab944 | Contact: Lukasz P. Kozlowski |