Microbacterium sp. cf046
Taxonomy: cellular organisms; Bacteria; Terrabacteria group; Actinobacteria; Actinomycetia; Micrococcales; Microbacteriaceae; Microbacterium; unclassified Microbacterium
Average proteome isoelectric point is 5.87
Get precalculated fractions of proteins
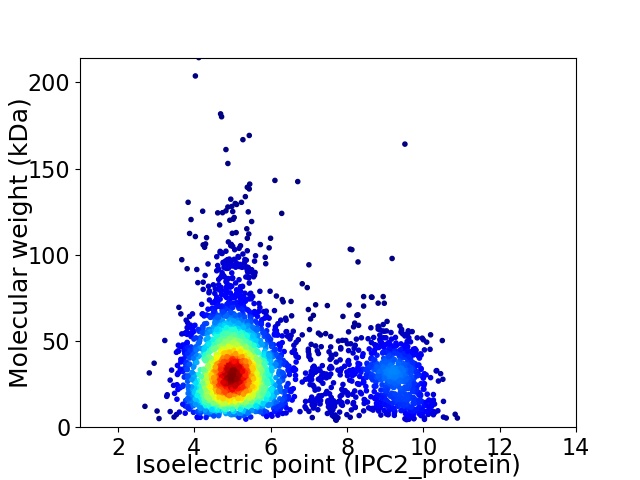
Virtual 2D-PAGE plot for 3641 proteins (isoelectric point calculated using IPC2_protein)
Get csv file with sequences according to given criteria:
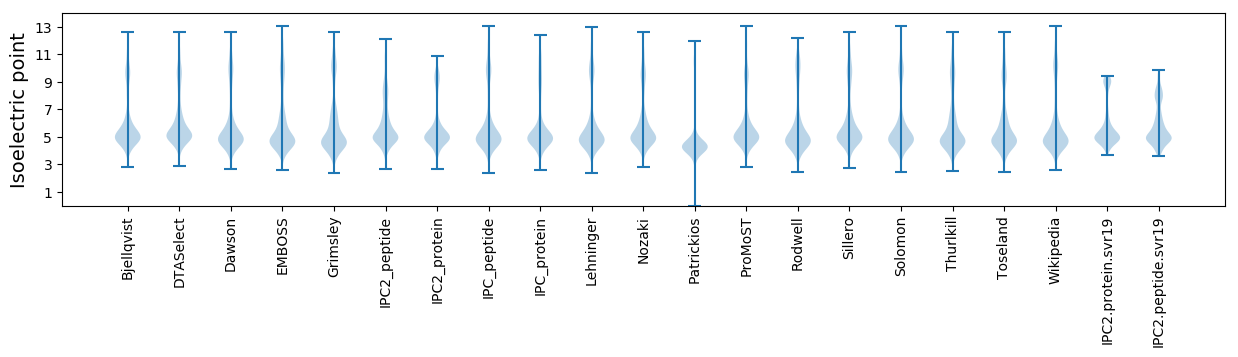
* You can choose from 21 different methods for calculating isoelectric point
Summary statistics related to proteome-wise predictions
Protein with the lowest isoelectric point:
>tr|A0A1I6MGU5|A0A1I6MGU5_9MICO Uncharacterized conserved protein circularly permuted ATPgrasp superfamily OS=Microbacterium sp. cf046 OX=1761803 GN=SAMN04487846_3000 PE=4 SV=1
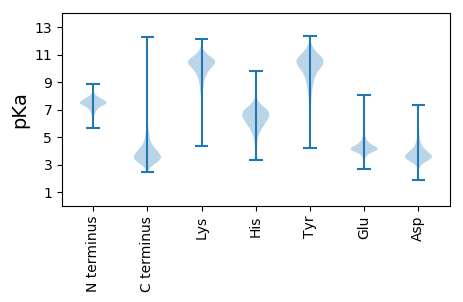
MM1 pKa = 7.34IRR3 pKa = 11.84WKK5 pKa = 10.39KK6 pKa = 9.6AAAAAAIAVTTALAVTACAGGSTDD30 pKa = 4.64GGGEE34 pKa = 4.15GAGTLTLGAIGAPTTFDD51 pKa = 3.58PAGSQWGNLSPFYY64 pKa = 10.45QAVFDD69 pKa = 4.24TLLLATPEE77 pKa = 4.18GTIEE81 pKa = 3.82PWLATEE87 pKa = 4.74WSYY90 pKa = 12.27NDD92 pKa = 4.13DD93 pKa = 3.76NTVLTLTLRR102 pKa = 11.84DD103 pKa = 4.01DD104 pKa = 3.81VTFSDD109 pKa = 4.64GSKK112 pKa = 9.12LTADD116 pKa = 3.55VVAKK120 pKa = 10.34NLQRR124 pKa = 11.84FKK126 pKa = 11.28DD127 pKa = 3.84GTSPDD132 pKa = 3.15AGYY135 pKa = 9.51FAGVASFEE143 pKa = 4.52APDD146 pKa = 3.76DD147 pKa = 3.88TTVVITLSAPDD158 pKa = 4.03PAMLNYY164 pKa = 8.63LTRR167 pKa = 11.84DD168 pKa = 3.42PGLVGAEE175 pKa = 4.17ASLDD179 pKa = 3.8SADD182 pKa = 3.89AATNPVGSGPYY193 pKa = 9.88ILDD196 pKa = 3.24TAATVTGTTYY206 pKa = 10.95SYY208 pKa = 10.95TKK210 pKa = 10.86NPDD213 pKa = 2.68YY214 pKa = 10.68WNPDD218 pKa = 2.66VQYY221 pKa = 11.21YY222 pKa = 10.74DD223 pKa = 3.48NLVINVLSDD232 pKa = 3.12PTAALNAIKK241 pKa = 10.33AGEE244 pKa = 4.02ANGVKK249 pKa = 10.06LANNDD254 pKa = 3.17ALTEE258 pKa = 4.04VEE260 pKa = 4.05AAGWTVNANEE270 pKa = 5.21LDD272 pKa = 3.93FQGLLLLDD280 pKa = 4.02RR281 pKa = 11.84AGTMDD286 pKa = 4.61PALADD291 pKa = 3.49VKK293 pKa = 10.74VRR295 pKa = 11.84QAINYY300 pKa = 9.26AFDD303 pKa = 4.42RR304 pKa = 11.84DD305 pKa = 3.9GLLTALQTDD314 pKa = 3.95HH315 pKa = 6.51GTVTTQVFPATSDD328 pKa = 3.41AYY330 pKa = 10.78DD331 pKa = 4.22PEE333 pKa = 6.02LDD335 pKa = 3.64SYY337 pKa = 11.84YY338 pKa = 10.91DD339 pKa = 3.87YY340 pKa = 11.48DD341 pKa = 3.78PEE343 pKa = 4.34KK344 pKa = 10.88AKK346 pKa = 10.73EE347 pKa = 3.92LLAEE351 pKa = 4.43AGYY354 pKa = 9.92PDD356 pKa = 4.57GLSISMPTVSVLSATTYY373 pKa = 10.66TLVAQQLADD382 pKa = 3.38VGITVEE388 pKa = 4.17ATDD391 pKa = 3.72VPVGNFIADD400 pKa = 3.62MLAPKK405 pKa = 10.5YY406 pKa = 9.27PATFMALEE414 pKa = 4.26QNPDD418 pKa = 2.7WQLIQFMIAPNAVFNPFKK436 pKa = 10.96YY437 pKa = 9.93QDD439 pKa = 3.87PQVDD443 pKa = 4.07EE444 pKa = 4.64YY445 pKa = 10.91IKK447 pKa = 10.06EE448 pKa = 3.81IQYY451 pKa = 11.28GDD453 pKa = 4.06EE454 pKa = 3.93ATQASVAKK462 pKa = 9.68EE463 pKa = 3.68LNTYY467 pKa = 9.79IVEE470 pKa = 4.46QAWFAPFYY478 pKa = 10.24RR479 pKa = 11.84VQGSVATDD487 pKa = 3.11ANTTVEE493 pKa = 4.19MLPTNAYY500 pKa = 8.08PAIYY504 pKa = 10.15DD505 pKa = 3.79FQPKK509 pKa = 7.63QQ510 pKa = 3.15
MM1 pKa = 7.34IRR3 pKa = 11.84WKK5 pKa = 10.39KK6 pKa = 9.6AAAAAAIAVTTALAVTACAGGSTDD30 pKa = 4.64GGGEE34 pKa = 4.15GAGTLTLGAIGAPTTFDD51 pKa = 3.58PAGSQWGNLSPFYY64 pKa = 10.45QAVFDD69 pKa = 4.24TLLLATPEE77 pKa = 4.18GTIEE81 pKa = 3.82PWLATEE87 pKa = 4.74WSYY90 pKa = 12.27NDD92 pKa = 4.13DD93 pKa = 3.76NTVLTLTLRR102 pKa = 11.84DD103 pKa = 4.01DD104 pKa = 3.81VTFSDD109 pKa = 4.64GSKK112 pKa = 9.12LTADD116 pKa = 3.55VVAKK120 pKa = 10.34NLQRR124 pKa = 11.84FKK126 pKa = 11.28DD127 pKa = 3.84GTSPDD132 pKa = 3.15AGYY135 pKa = 9.51FAGVASFEE143 pKa = 4.52APDD146 pKa = 3.76DD147 pKa = 3.88TTVVITLSAPDD158 pKa = 4.03PAMLNYY164 pKa = 8.63LTRR167 pKa = 11.84DD168 pKa = 3.42PGLVGAEE175 pKa = 4.17ASLDD179 pKa = 3.8SADD182 pKa = 3.89AATNPVGSGPYY193 pKa = 9.88ILDD196 pKa = 3.24TAATVTGTTYY206 pKa = 10.95SYY208 pKa = 10.95TKK210 pKa = 10.86NPDD213 pKa = 2.68YY214 pKa = 10.68WNPDD218 pKa = 2.66VQYY221 pKa = 11.21YY222 pKa = 10.74DD223 pKa = 3.48NLVINVLSDD232 pKa = 3.12PTAALNAIKK241 pKa = 10.33AGEE244 pKa = 4.02ANGVKK249 pKa = 10.06LANNDD254 pKa = 3.17ALTEE258 pKa = 4.04VEE260 pKa = 4.05AAGWTVNANEE270 pKa = 5.21LDD272 pKa = 3.93FQGLLLLDD280 pKa = 4.02RR281 pKa = 11.84AGTMDD286 pKa = 4.61PALADD291 pKa = 3.49VKK293 pKa = 10.74VRR295 pKa = 11.84QAINYY300 pKa = 9.26AFDD303 pKa = 4.42RR304 pKa = 11.84DD305 pKa = 3.9GLLTALQTDD314 pKa = 3.95HH315 pKa = 6.51GTVTTQVFPATSDD328 pKa = 3.41AYY330 pKa = 10.78DD331 pKa = 4.22PEE333 pKa = 6.02LDD335 pKa = 3.64SYY337 pKa = 11.84YY338 pKa = 10.91DD339 pKa = 3.87YY340 pKa = 11.48DD341 pKa = 3.78PEE343 pKa = 4.34KK344 pKa = 10.88AKK346 pKa = 10.73EE347 pKa = 3.92LLAEE351 pKa = 4.43AGYY354 pKa = 9.92PDD356 pKa = 4.57GLSISMPTVSVLSATTYY373 pKa = 10.66TLVAQQLADD382 pKa = 3.38VGITVEE388 pKa = 4.17ATDD391 pKa = 3.72VPVGNFIADD400 pKa = 3.62MLAPKK405 pKa = 10.5YY406 pKa = 9.27PATFMALEE414 pKa = 4.26QNPDD418 pKa = 2.7WQLIQFMIAPNAVFNPFKK436 pKa = 10.96YY437 pKa = 9.93QDD439 pKa = 3.87PQVDD443 pKa = 4.07EE444 pKa = 4.64YY445 pKa = 10.91IKK447 pKa = 10.06EE448 pKa = 3.81IQYY451 pKa = 11.28GDD453 pKa = 4.06EE454 pKa = 3.93ATQASVAKK462 pKa = 9.68EE463 pKa = 3.68LNTYY467 pKa = 9.79IVEE470 pKa = 4.46QAWFAPFYY478 pKa = 10.24RR479 pKa = 11.84VQGSVATDD487 pKa = 3.11ANTTVEE493 pKa = 4.19MLPTNAYY500 pKa = 8.08PAIYY504 pKa = 10.15DD505 pKa = 3.79FQPKK509 pKa = 7.63QQ510 pKa = 3.15
Molecular weight: 54.48 kDa
Isoelectric point according different methods:
Protein with the highest isoelectric point:
>tr|A0A1I6KT77|A0A1I6KT77_9MICO DNA-binding response regulator NarL/FixJ family contains REC and HTH domains OS=Microbacterium sp. cf046 OX=1761803 GN=SAMN04487846_0907 PE=4 SV=1
MM1 pKa = 7.34KK2 pKa = 10.44RR3 pKa = 11.84FWLFLIPGVILSAVGLVWTLQGLNVLGGSAMSGSPLWATIGPIVLVVGVVLIVIAIVIAVRR64 pKa = 11.84RR65 pKa = 11.84RR66 pKa = 11.84RR67 pKa = 11.84TQPP70 pKa = 2.79
MM1 pKa = 7.34KK2 pKa = 10.44RR3 pKa = 11.84FWLFLIPGVILSAVGLVWTLQGLNVLGGSAMSGSPLWATIGPIVLVVGVVLIVIAIVIAVRR64 pKa = 11.84RR65 pKa = 11.84RR66 pKa = 11.84RR67 pKa = 11.84TQPP70 pKa = 2.79
Molecular weight: 7.49 kDa
Isoelectric point according different methods:
Peptides (in silico digests for buttom-up proteomics)
Below you can find in silico digests of the whole proteome with Trypsin, Chymotrypsin, Trypsin+LysC, LysN, ArgC proteases suitable for different mass spec machines.| Try ESI |
 |
|---|
| ChTry ESI |
|
|---|
| ArgC ESI |
|
|---|
| LysN ESI |
|
|---|
| TryLysC ESI |
|
|---|
| Try MALDI |
|
|---|
| ChTry MALDI |
|
|---|
| ArgC MALDI |
|
|---|
| LysN MALDI |
|
|---|
| TryLysC MALDI |
|
|---|
| Try LTQ |
|
|---|
| ChTry LTQ |
|
|---|
| ArgC LTQ |
|
|---|
| LysN LTQ |
|
|---|
| TryLysC LTQ |
|
|---|
| Try MSlow |
|
|---|
| ChTry MSlow |
|
|---|
| ArgC MSlow |
|
|---|
| LysN MSlow |
|
|---|
| TryLysC MSlow |
|
|---|
| Try MShigh |
|
|---|
| ChTry MShigh |
|
|---|
| ArgC MShigh |
|
|---|
| LysN MShigh |
|
|---|
| TryLysC MShigh |
|
|---|
General Statistics
Number of major isoforms |
Number of additional isoforms |
Number of all proteins |
Number of amino acids |
Min. Seq. Length |
Max. Seq. Length |
Avg. Seq. Length |
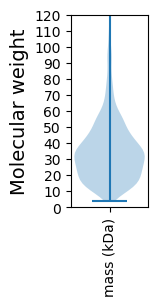
Avg. Mol. Weight |
|---|---|---|---|---|---|---|---|
0 |
1231243 |
37 |
2020 |
338.2 |
36.22 |
Amino acid frequency
Ala |
Cys |
Asp |
Glu |
Phe |
Gly |
His |
Ile |
Lys |
Leu |
|---|---|---|---|---|---|---|---|---|---|
13.525 ± 0.059 | 0.486 ± 0.009 |
6.424 ± 0.037 | 5.643 ± 0.039 |
3.229 ± 0.026 | 8.925 ± 0.035 |
1.98 ± 0.02 | 4.82 ± 0.031 |
1.788 ± 0.027 | 10.004 ± 0.045 |
Met |
Asn |
Gln |
Pro |
Arg |
Ser |
Thr |
Val |
Trp |
Tyr |
|---|---|---|---|---|---|---|---|---|---|
1.798 ± 0.016 | 1.872 ± 0.02 |
5.545 ± 0.03 | 2.696 ± 0.019 |
7.286 ± 0.043 | 5.614 ± 0.026 |
5.956 ± 0.032 | 8.762 ± 0.038 |
1.612 ± 0.019 | 2.034 ± 0.019 |
Most of the basic statistics you can see at this page can be downloaded from this CSV file
See this proteome in:

Proteome-pI is available under Creative Commons Attribution-NoDerivs license, for more details see here
| Reference: Kozlowski LP. Proteome-pI 2.0: Proteome Isoelectric Point Database Update. Nucleic Acids Res. 2021, doi: 10.1093/nar/gkab944 | Contact: Lukasz P. Kozlowski |