Aspergillus sclerotiicarbonarius (strain CBS 121057 / IBT 28362)
Taxonomy: cellular organisms; Eukaryota; Opisthokonta; Fungi; Dikarya; Ascomycota; saccharomyceta; Pezizomycotina; leotiomyceta; Eurotiomycetes; Eurotiomycetidae; Eurotiales; Aspergillaceae; Aspergillus; Aspergillus sclerotiicarbonarius
Average proteome isoelectric point is 6.39
Get precalculated fractions of proteins
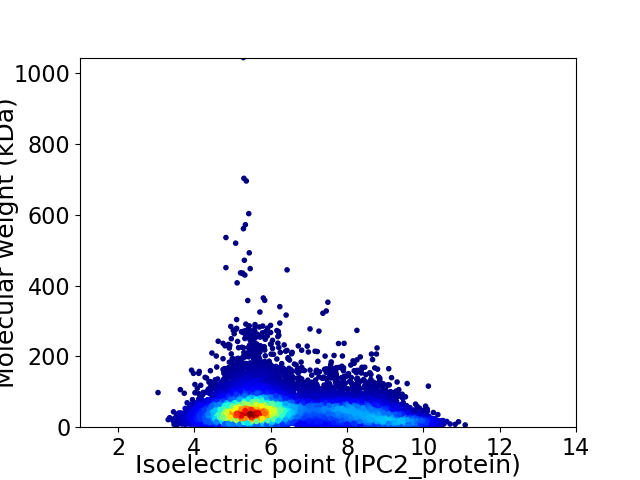
Virtual 2D-PAGE plot for 12562 proteins (isoelectric point calculated using IPC2_protein)
Get csv file with sequences according to given criteria:
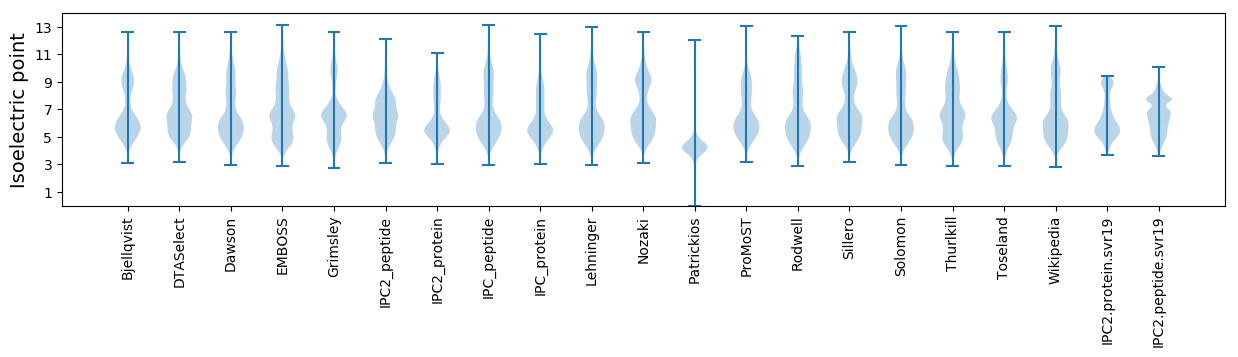
* You can choose from 21 different methods for calculating isoelectric point
Summary statistics related to proteome-wise predictions
Protein with the lowest isoelectric point:
>tr|A0A319EYX3|A0A319EYX3_ASPSB Plasma membrane proteolipid 3 OS=Aspergillus sclerotiicarbonarius (strain CBS 121057 / IBT 28362) OX=1448318 GN=BO78DRAFT_237843 PE=3 SV=1
MM1 pKa = 7.14KK2 pKa = 9.74TYY4 pKa = 11.16SLLSTVAILGSFPFASTKK22 pKa = 9.91TINFVAHH29 pKa = 6.55QDD31 pKa = 3.57DD32 pKa = 4.63DD33 pKa = 5.01LLFLSPDD40 pKa = 4.47LIRR43 pKa = 11.84DD44 pKa = 3.61ILSGEE49 pKa = 4.2PVRR52 pKa = 11.84TVYY55 pKa = 9.34LTAGDD60 pKa = 4.09AGLGSDD66 pKa = 3.3YY67 pKa = 10.84WLGRR71 pKa = 11.84EE72 pKa = 4.41HH73 pKa = 7.52GSQAAYY79 pKa = 10.84ARR81 pKa = 11.84MSVASNTWIEE91 pKa = 3.99SDD93 pKa = 4.72AGIDD97 pKa = 3.99DD98 pKa = 4.7KK99 pKa = 11.69DD100 pKa = 3.25ITLYY104 pKa = 10.28TLQDD108 pKa = 3.66DD109 pKa = 4.29QNISLVFMHH118 pKa = 6.99LPDD121 pKa = 4.75GNLDD125 pKa = 3.72GTGFAADD132 pKa = 4.33EE133 pKa = 4.18NDD135 pKa = 3.82SLEE138 pKa = 4.16KK139 pKa = 10.66LWDD142 pKa = 3.76GSIDD146 pKa = 3.85EE147 pKa = 4.84IRR149 pKa = 11.84TIDD152 pKa = 4.11GSGTTYY158 pKa = 10.52TRR160 pKa = 11.84DD161 pKa = 3.35EE162 pKa = 4.33LLEE165 pKa = 4.35TIAALIDD172 pKa = 4.0DD173 pKa = 4.97FEE175 pKa = 6.6PDD177 pKa = 3.28EE178 pKa = 4.74VKK180 pKa = 10.29TGDD183 pKa = 3.6YY184 pKa = 11.43VNDD187 pKa = 4.35FGDD190 pKa = 4.38GDD192 pKa = 4.1HH193 pKa = 7.19SDD195 pKa = 4.11HH196 pKa = 6.56YY197 pKa = 10.19ATGYY201 pKa = 9.57FVNNALQASDD211 pKa = 4.17SNASLVGYY219 pKa = 9.43YY220 pKa = 10.2GYY222 pKa = 9.46PIQDD226 pKa = 2.81MDD228 pKa = 4.05VNLNGSDD235 pKa = 4.39IEE237 pKa = 4.39DD238 pKa = 3.53KK239 pKa = 11.27TNIFYY244 pKa = 10.62EE245 pKa = 4.27YY246 pKa = 10.59AAYY249 pKa = 8.07DD250 pKa = 3.6TATCSTADD258 pKa = 3.52SCSSRR263 pKa = 11.84PEE265 pKa = 4.02SSWLQRR271 pKa = 11.84EE272 pKa = 4.44YY273 pKa = 11.1EE274 pKa = 4.24VV275 pKa = 4.24
MM1 pKa = 7.14KK2 pKa = 9.74TYY4 pKa = 11.16SLLSTVAILGSFPFASTKK22 pKa = 9.91TINFVAHH29 pKa = 6.55QDD31 pKa = 3.57DD32 pKa = 4.63DD33 pKa = 5.01LLFLSPDD40 pKa = 4.47LIRR43 pKa = 11.84DD44 pKa = 3.61ILSGEE49 pKa = 4.2PVRR52 pKa = 11.84TVYY55 pKa = 9.34LTAGDD60 pKa = 4.09AGLGSDD66 pKa = 3.3YY67 pKa = 10.84WLGRR71 pKa = 11.84EE72 pKa = 4.41HH73 pKa = 7.52GSQAAYY79 pKa = 10.84ARR81 pKa = 11.84MSVASNTWIEE91 pKa = 3.99SDD93 pKa = 4.72AGIDD97 pKa = 3.99DD98 pKa = 4.7KK99 pKa = 11.69DD100 pKa = 3.25ITLYY104 pKa = 10.28TLQDD108 pKa = 3.66DD109 pKa = 4.29QNISLVFMHH118 pKa = 6.99LPDD121 pKa = 4.75GNLDD125 pKa = 3.72GTGFAADD132 pKa = 4.33EE133 pKa = 4.18NDD135 pKa = 3.82SLEE138 pKa = 4.16KK139 pKa = 10.66LWDD142 pKa = 3.76GSIDD146 pKa = 3.85EE147 pKa = 4.84IRR149 pKa = 11.84TIDD152 pKa = 4.11GSGTTYY158 pKa = 10.52TRR160 pKa = 11.84DD161 pKa = 3.35EE162 pKa = 4.33LLEE165 pKa = 4.35TIAALIDD172 pKa = 4.0DD173 pKa = 4.97FEE175 pKa = 6.6PDD177 pKa = 3.28EE178 pKa = 4.74VKK180 pKa = 10.29TGDD183 pKa = 3.6YY184 pKa = 11.43VNDD187 pKa = 4.35FGDD190 pKa = 4.38GDD192 pKa = 4.1HH193 pKa = 7.19SDD195 pKa = 4.11HH196 pKa = 6.56YY197 pKa = 10.19ATGYY201 pKa = 9.57FVNNALQASDD211 pKa = 4.17SNASLVGYY219 pKa = 9.43YY220 pKa = 10.2GYY222 pKa = 9.46PIQDD226 pKa = 2.81MDD228 pKa = 4.05VNLNGSDD235 pKa = 4.39IEE237 pKa = 4.39DD238 pKa = 3.53KK239 pKa = 11.27TNIFYY244 pKa = 10.62EE245 pKa = 4.27YY246 pKa = 10.59AAYY249 pKa = 8.07DD250 pKa = 3.6TATCSTADD258 pKa = 3.52SCSSRR263 pKa = 11.84PEE265 pKa = 4.02SSWLQRR271 pKa = 11.84EE272 pKa = 4.44YY273 pKa = 11.1EE274 pKa = 4.24VV275 pKa = 4.24
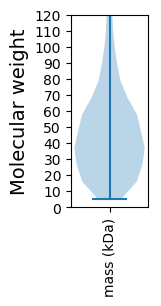
Molecular weight: 30.28 kDa
Isoelectric point according different methods:
Protein with the highest isoelectric point:
>tr|A0A319ELJ4|A0A319ELJ4_ASPSB Bifunctional cytochrome P450/NADPH--P450 reductase OS=Aspergillus sclerotiicarbonarius (strain CBS 121057 / IBT 28362) OX=1448318 GN=BO78DRAFT_366756 PE=3 SV=1
MM1 pKa = 7.88PSHH4 pKa = 6.91KK5 pKa = 10.39SFRR8 pKa = 11.84TKK10 pKa = 10.45QKK12 pKa = 9.54LAKK15 pKa = 9.74AQRR18 pKa = 11.84QNRR21 pKa = 11.84PIPQWIRR28 pKa = 11.84LRR30 pKa = 11.84TGNTIRR36 pKa = 11.84YY37 pKa = 5.79NAKK40 pKa = 8.89RR41 pKa = 11.84RR42 pKa = 11.84HH43 pKa = 4.14WRR45 pKa = 11.84KK46 pKa = 7.41TRR48 pKa = 11.84LGII51 pKa = 4.46
MM1 pKa = 7.88PSHH4 pKa = 6.91KK5 pKa = 10.39SFRR8 pKa = 11.84TKK10 pKa = 10.45QKK12 pKa = 9.54LAKK15 pKa = 9.74AQRR18 pKa = 11.84QNRR21 pKa = 11.84PIPQWIRR28 pKa = 11.84LRR30 pKa = 11.84TGNTIRR36 pKa = 11.84YY37 pKa = 5.79NAKK40 pKa = 8.89RR41 pKa = 11.84RR42 pKa = 11.84HH43 pKa = 4.14WRR45 pKa = 11.84KK46 pKa = 7.41TRR48 pKa = 11.84LGII51 pKa = 4.46
Molecular weight: 6.28 kDa
Isoelectric point according different methods:
Peptides (in silico digests for buttom-up proteomics)
Below you can find in silico digests of the whole proteome with Trypsin, Chymotrypsin, Trypsin+LysC, LysN, ArgC proteases suitable for different mass spec machines.| Try ESI |
 |
|---|
| ChTry ESI |
|
|---|
| ArgC ESI |
|
|---|
| LysN ESI |
|
|---|
| TryLysC ESI |
|
|---|
| Try MALDI |
|
|---|
| ChTry MALDI |
|
|---|
| ArgC MALDI |
|
|---|
| LysN MALDI |
|
|---|
| TryLysC MALDI |
|
|---|
| Try LTQ |
|
|---|
| ChTry LTQ |
|
|---|
| ArgC LTQ |
|
|---|
| LysN LTQ |
|
|---|
| TryLysC LTQ |
|
|---|
| Try MSlow |
|
|---|
| ChTry MSlow |
|
|---|
| ArgC MSlow |
|
|---|
| LysN MSlow |
|
|---|
| TryLysC MSlow |
|
|---|
| Try MShigh |
|
|---|
| ChTry MShigh |
|
|---|
| ArgC MShigh |
|
|---|
| LysN MShigh |
|
|---|
| TryLysC MShigh |
|
|---|
General Statistics
Number of major isoforms |
Number of additional isoforms |
Number of all proteins |
Number of amino acids |
Min. Seq. Length |
Max. Seq. Length |
Avg. Seq. Length |
Avg. Mol. Weight |
|---|---|---|---|---|---|---|---|
0 |
5900208 |
49 |
9581 |
469.7 |
52.01 |
Amino acid frequency
Ala |
Cys |
Asp |
Glu |
Phe |
Gly |
His |
Ile |
Lys |
Leu |
|---|---|---|---|---|---|---|---|---|---|
8.458 ± 0.02 | 1.344 ± 0.009 |
5.6 ± 0.017 | 6.008 ± 0.021 |
3.773 ± 0.014 | 6.89 ± 0.021 |
2.498 ± 0.009 | 4.947 ± 0.017 |
4.239 ± 0.019 | 9.255 ± 0.026 |
Met |
Asn |
Gln |
Pro |
Arg |
Ser |
Thr |
Val |
Trp |
Tyr |
|---|---|---|---|---|---|---|---|---|---|
2.203 ± 0.007 | 3.474 ± 0.011 |
6.14 ± 0.026 | 4.008 ± 0.016 |
6.162 ± 0.02 | 8.222 ± 0.024 |
6.047 ± 0.015 | 6.287 ± 0.016 |
1.542 ± 0.008 | 2.904 ± 0.012 |
Most of the basic statistics you can see at this page can be downloaded from this CSV file
See this proteome in:

Proteome-pI is available under Creative Commons Attribution-NoDerivs license, for more details see here
| Reference: Kozlowski LP. Proteome-pI 2.0: Proteome Isoelectric Point Database Update. Nucleic Acids Res. 2021, doi: 10.1093/nar/gkab944 | Contact: Lukasz P. Kozlowski |