Human immunodeficiency virus type 2 subtype A (isolate ROD) (HIV-2)
Taxonomy: Viruses; Riboviria; Pararnavirae; Artverviricota; Revtraviricetes; Ortervirales; Retroviridae; Orthoretrovirinae; Lentivirus; Human immunodeficiency virus 2; HIV-2 subtype A
Average proteome isoelectric point is 7.78
Get precalculated fractions of proteins
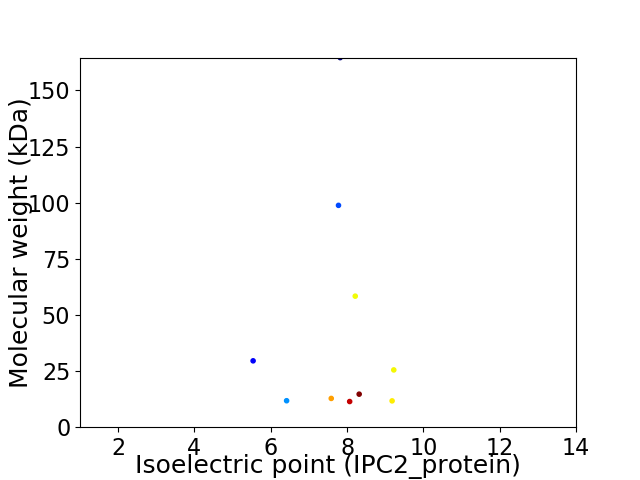
Virtual 2D-PAGE plot for 10 proteins (isoelectric point calculated using IPC2_protein)
Get csv file with sequences according to given criteria:
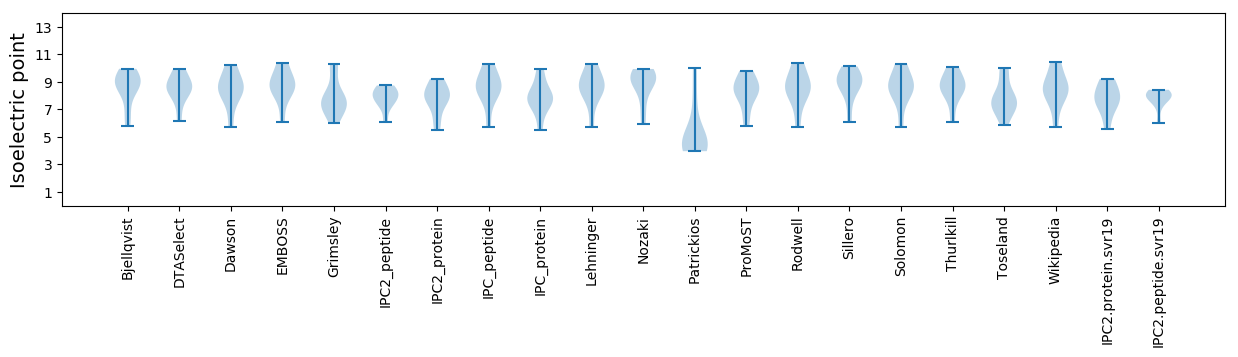
* You can choose from 21 different methods for calculating isoelectric point
Summary statistics related to proteome-wise predictions
Protein with the lowest isoelectric point:
>sp|P04605|TAT_HV2RO Protein Tat OS=Human immunodeficiency virus type 2 subtype A (isolate ROD) OX=11720 GN=tat PE=1 SV=1
MM1 pKa = 7.26GASGSKK7 pKa = 9.52KK8 pKa = 9.27HH9 pKa = 5.99SRR11 pKa = 11.84PPRR14 pKa = 11.84GLQEE18 pKa = 3.8RR19 pKa = 11.84LLRR22 pKa = 11.84ARR24 pKa = 11.84AGACGGYY31 pKa = 8.78WNEE34 pKa = 4.2SGGEE38 pKa = 3.8YY39 pKa = 10.48SRR41 pKa = 11.84FQEE44 pKa = 5.1GSDD47 pKa = 3.66RR48 pKa = 11.84EE49 pKa = 4.34QKK51 pKa = 10.7SPSCEE56 pKa = 3.31GRR58 pKa = 11.84QYY60 pKa = 10.61QQGDD64 pKa = 3.75FMNTPWKK71 pKa = 10.71DD72 pKa = 3.19PAAEE76 pKa = 4.09RR77 pKa = 11.84EE78 pKa = 4.23KK79 pKa = 11.22NLYY82 pKa = 8.96RR83 pKa = 11.84QQNMDD88 pKa = 4.94DD89 pKa = 3.95VDD91 pKa = 5.13SDD93 pKa = 5.15DD94 pKa = 4.77DD95 pKa = 4.07DD96 pKa = 3.72QVRR99 pKa = 11.84VSVTPKK105 pKa = 10.0VPLRR109 pKa = 11.84PMTHH113 pKa = 6.91RR114 pKa = 11.84LAIDD118 pKa = 3.26MSHH121 pKa = 7.6LIKK124 pKa = 10.16TRR126 pKa = 11.84GGLEE130 pKa = 3.66GMFYY134 pKa = 10.2SEE136 pKa = 4.72RR137 pKa = 11.84RR138 pKa = 11.84HH139 pKa = 6.26KK140 pKa = 10.39ILNIYY145 pKa = 9.03LEE147 pKa = 4.32KK148 pKa = 10.97EE149 pKa = 3.82EE150 pKa = 5.7GIIADD155 pKa = 3.76WQNYY159 pKa = 4.85THH161 pKa = 7.08GPGVRR166 pKa = 11.84YY167 pKa = 9.54PMFFGWLWKK176 pKa = 10.09LVPVDD181 pKa = 3.95VPQEE185 pKa = 4.32GEE187 pKa = 3.99DD188 pKa = 4.07TEE190 pKa = 4.72THH192 pKa = 6.35CLVHH196 pKa = 6.67PAQTSKK202 pKa = 10.91FDD204 pKa = 4.06DD205 pKa = 3.71PHH207 pKa = 8.37GEE209 pKa = 4.06TLVWEE214 pKa = 4.72FDD216 pKa = 3.49PLLAYY221 pKa = 10.32SYY223 pKa = 10.25EE224 pKa = 3.93AFIRR228 pKa = 11.84YY229 pKa = 8.95PEE231 pKa = 4.15EE232 pKa = 4.24FGHH235 pKa = 7.31KK236 pKa = 9.93SGLPEE241 pKa = 4.25EE242 pKa = 4.26EE243 pKa = 3.6WKK245 pKa = 11.05ARR247 pKa = 11.84LKK249 pKa = 11.08ARR251 pKa = 11.84GIPFSS256 pKa = 3.71
MM1 pKa = 7.26GASGSKK7 pKa = 9.52KK8 pKa = 9.27HH9 pKa = 5.99SRR11 pKa = 11.84PPRR14 pKa = 11.84GLQEE18 pKa = 3.8RR19 pKa = 11.84LLRR22 pKa = 11.84ARR24 pKa = 11.84AGACGGYY31 pKa = 8.78WNEE34 pKa = 4.2SGGEE38 pKa = 3.8YY39 pKa = 10.48SRR41 pKa = 11.84FQEE44 pKa = 5.1GSDD47 pKa = 3.66RR48 pKa = 11.84EE49 pKa = 4.34QKK51 pKa = 10.7SPSCEE56 pKa = 3.31GRR58 pKa = 11.84QYY60 pKa = 10.61QQGDD64 pKa = 3.75FMNTPWKK71 pKa = 10.71DD72 pKa = 3.19PAAEE76 pKa = 4.09RR77 pKa = 11.84EE78 pKa = 4.23KK79 pKa = 11.22NLYY82 pKa = 8.96RR83 pKa = 11.84QQNMDD88 pKa = 4.94DD89 pKa = 3.95VDD91 pKa = 5.13SDD93 pKa = 5.15DD94 pKa = 4.77DD95 pKa = 4.07DD96 pKa = 3.72QVRR99 pKa = 11.84VSVTPKK105 pKa = 10.0VPLRR109 pKa = 11.84PMTHH113 pKa = 6.91RR114 pKa = 11.84LAIDD118 pKa = 3.26MSHH121 pKa = 7.6LIKK124 pKa = 10.16TRR126 pKa = 11.84GGLEE130 pKa = 3.66GMFYY134 pKa = 10.2SEE136 pKa = 4.72RR137 pKa = 11.84RR138 pKa = 11.84HH139 pKa = 6.26KK140 pKa = 10.39ILNIYY145 pKa = 9.03LEE147 pKa = 4.32KK148 pKa = 10.97EE149 pKa = 3.82EE150 pKa = 5.7GIIADD155 pKa = 3.76WQNYY159 pKa = 4.85THH161 pKa = 7.08GPGVRR166 pKa = 11.84YY167 pKa = 9.54PMFFGWLWKK176 pKa = 10.09LVPVDD181 pKa = 3.95VPQEE185 pKa = 4.32GEE187 pKa = 3.99DD188 pKa = 4.07TEE190 pKa = 4.72THH192 pKa = 6.35CLVHH196 pKa = 6.67PAQTSKK202 pKa = 10.91FDD204 pKa = 4.06DD205 pKa = 3.71PHH207 pKa = 8.37GEE209 pKa = 4.06TLVWEE214 pKa = 4.72FDD216 pKa = 3.49PLLAYY221 pKa = 10.32SYY223 pKa = 10.25EE224 pKa = 3.93AFIRR228 pKa = 11.84YY229 pKa = 8.95PEE231 pKa = 4.15EE232 pKa = 4.24FGHH235 pKa = 7.31KK236 pKa = 9.93SGLPEE241 pKa = 4.25EE242 pKa = 4.26EE243 pKa = 3.6WKK245 pKa = 11.05ARR247 pKa = 11.84LKK249 pKa = 11.08ARR251 pKa = 11.84GIPFSS256 pKa = 3.71
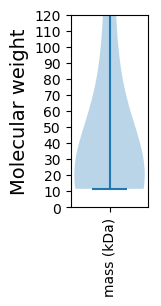
Molecular weight: 29.57 kDa
Isoelectric point according different methods:
Protein with the highest isoelectric point:
>sp|P06938|VPR_HV2RO Protein Vpr OS=Human immunodeficiency virus type 2 subtype A (isolate ROD) OX=11720 GN=vpr PE=3 SV=1
MM1 pKa = 7.52NEE3 pKa = 3.82RR4 pKa = 11.84ADD6 pKa = 3.8EE7 pKa = 4.39EE8 pKa = 4.42GLQRR12 pKa = 11.84KK13 pKa = 8.38LRR15 pKa = 11.84LIRR18 pKa = 11.84LLHH21 pKa = 4.91QTNPYY26 pKa = 8.44PQGPGTASQRR36 pKa = 11.84RR37 pKa = 11.84NRR39 pKa = 11.84RR40 pKa = 11.84RR41 pKa = 11.84RR42 pKa = 11.84WKK44 pKa = 10.0QRR46 pKa = 11.84WRR48 pKa = 11.84QILALADD55 pKa = 3.88SIYY58 pKa = 10.61TFPDD62 pKa = 3.87PPADD66 pKa = 3.68SPLDD70 pKa = 3.29QTIQHH75 pKa = 6.05LQGLTIQEE83 pKa = 4.45LPDD86 pKa = 4.45PPTHH90 pKa = 6.53LPEE93 pKa = 4.25SQRR96 pKa = 11.84LAEE99 pKa = 4.17TT100 pKa = 3.73
MM1 pKa = 7.52NEE3 pKa = 3.82RR4 pKa = 11.84ADD6 pKa = 3.8EE7 pKa = 4.39EE8 pKa = 4.42GLQRR12 pKa = 11.84KK13 pKa = 8.38LRR15 pKa = 11.84LIRR18 pKa = 11.84LLHH21 pKa = 4.91QTNPYY26 pKa = 8.44PQGPGTASQRR36 pKa = 11.84RR37 pKa = 11.84NRR39 pKa = 11.84RR40 pKa = 11.84RR41 pKa = 11.84RR42 pKa = 11.84WKK44 pKa = 10.0QRR46 pKa = 11.84WRR48 pKa = 11.84QILALADD55 pKa = 3.88SIYY58 pKa = 10.61TFPDD62 pKa = 3.87PPADD66 pKa = 3.68SPLDD70 pKa = 3.29QTIQHH75 pKa = 6.05LQGLTIQEE83 pKa = 4.45LPDD86 pKa = 4.45PPTHH90 pKa = 6.53LPEE93 pKa = 4.25SQRR96 pKa = 11.84LAEE99 pKa = 4.17TT100 pKa = 3.73
Molecular weight: 11.73 kDa
Isoelectric point according different methods:
Peptides (in silico digests for buttom-up proteomics)
Below you can find in silico digests of the whole proteome with Trypsin, Chymotrypsin, Trypsin+LysC, LysN, ArgC proteases suitable for different mass spec machines.| Try ESI |
 |
|---|
| ChTry ESI |
|
|---|
| ArgC ESI |
|
|---|
| LysN ESI |
|
|---|
| TryLysC ESI |
|
|---|
| Try MALDI |
|
|---|
| ChTry MALDI |
|
|---|
| ArgC MALDI |
|
|---|
| LysN MALDI |
|
|---|
| TryLysC MALDI |
|
|---|
| Try LTQ |
|
|---|
| ChTry LTQ |
|
|---|
| ArgC LTQ |
|
|---|
| LysN LTQ |
|
|---|
| TryLysC LTQ |
|
|---|
| Try MSlow |
|
|---|
| ChTry MSlow |
|
|---|
| ArgC MSlow |
|
|---|
| LysN MSlow |
|
|---|
| TryLysC MSlow |
|
|---|
| Try MShigh |
|
|---|
| ChTry MShigh |
|
|---|
| ArgC MShigh |
|
|---|
| LysN MShigh |
|
|---|
| TryLysC MShigh |
|
|---|
General Statistics
Number of major isoforms |
Number of additional isoforms |
Number of all proteins |
Number of amino acids |
Min. Seq. Length |
Max. Seq. Length |
Avg. Seq. Length |
Avg. Mol. Weight |
|---|---|---|---|---|---|---|---|
3861 |
99 |
1464 |
386.1 |
43.94 |
Amino acid frequency
Ala |
Cys |
Asp |
Glu |
Phe |
Gly |
His |
Ile |
Lys |
Leu |
|---|---|---|---|---|---|---|---|---|---|
6.371 ± 0.353 | 2.461 ± 0.516 |
3.885 ± 0.326 | 7.407 ± 0.635 |
2.668 ± 0.202 | 7.148 ± 0.773 |
2.409 ± 0.189 | 5.698 ± 0.7 |
6.501 ± 0.835 | 8.055 ± 0.339 |
Met |
Asn |
Gln |
Pro |
Arg |
Ser |
Thr |
Val |
Trp |
Tyr |
|---|---|---|---|---|---|---|---|---|---|
2.098 ± 0.172 | 4.325 ± 0.556 |
6.268 ± 0.881 | 5.776 ± 0.338 |
6.708 ± 0.785 | 4.766 ± 0.553 |
6.346 ± 0.8 | 5.439 ± 0.56 |
2.564 ± 0.333 | 3.108 ± 0.496 |
Most of the basic statistics you can see at this page can be downloaded from this CSV file
See this proteome in:

Proteome-pI is available under Creative Commons Attribution-NoDerivs license, for more details see here
| Reference: Kozlowski LP. Proteome-pI 2.0: Proteome Isoelectric Point Database Update. Nucleic Acids Res. 2021, doi: 10.1093/nar/gkab944 | Contact: Lukasz P. Kozlowski |