Bos grunniens papillomavirus 1
Taxonomy: Viruses; Monodnaviria; Shotokuvirae; Cossaviricota; Papovaviricetes; Zurhausenvirales; Papillomaviridae; Firstpapillomavirinae; Deltapapillomavirus; Deltapapillomavirus 4
Average proteome isoelectric point is 6.7
Get precalculated fractions of proteins
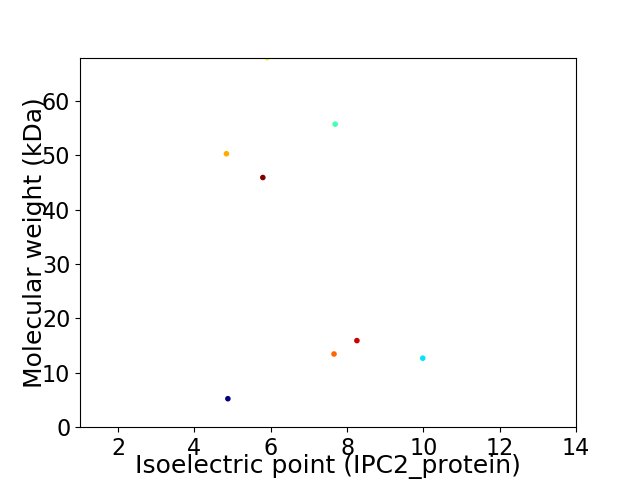
Virtual 2D-PAGE plot for 8 proteins (isoelectric point calculated using IPC2_protein)
Get csv file with sequences according to given criteria:
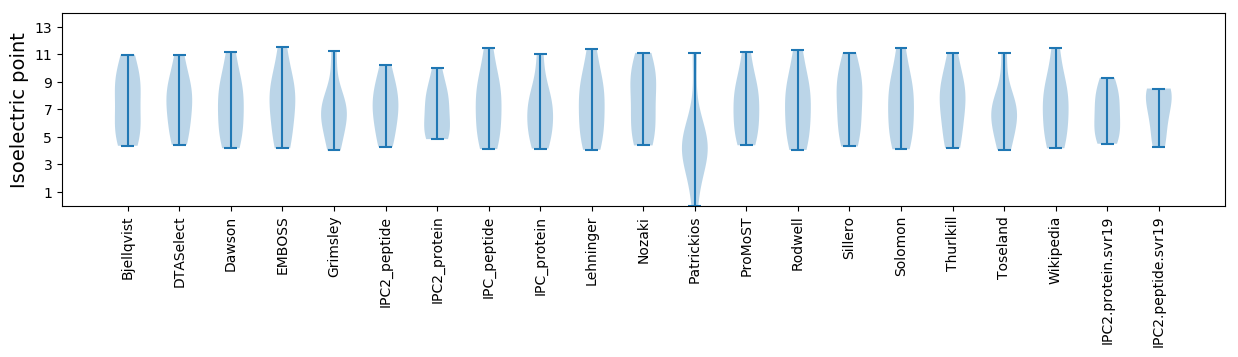
* You can choose from 21 different methods for calculating isoelectric point
Summary statistics related to proteome-wise predictions
Protein with the lowest isoelectric point:
>tr|J7K4X5|J7K4X5_BPV1 Replication protein E1 OS=Bos grunniens papillomavirus 1 OX=2758380 GN=E1 PE=3 SV=1
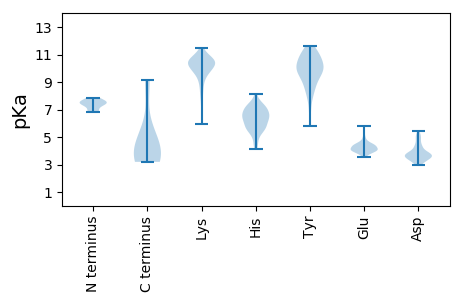
MM1 pKa = 7.49PNLWFLLFLGLVAAMQLLLLLFLLLFFLVYY31 pKa = 9.25WDD33 pKa = 4.88HH34 pKa = 6.96FEE36 pKa = 4.44CSCTSLPFF44 pKa = 4.63
MM1 pKa = 7.49PNLWFLLFLGLVAAMQLLLLLFLLLFFLVYY31 pKa = 9.25WDD33 pKa = 4.88HH34 pKa = 6.96FEE36 pKa = 4.44CSCTSLPFF44 pKa = 4.63
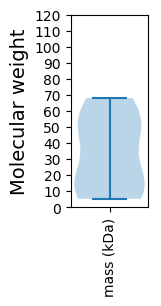
Molecular weight: 5.24 kDa
Isoelectric point according different methods:
Protein with the highest isoelectric point:
>tr|J7K4Y3|J7K4Y3_BPV1 Minor capsid protein L2 OS=Bos grunniens papillomavirus 1 OX=2758380 GN=L2 PE=3 SV=1
MM1 pKa = 7.4LVFHH5 pKa = 7.24PPLLILEE12 pKa = 4.69IAQTGSGSHH21 pKa = 6.35PRR23 pKa = 11.84DD24 pKa = 3.19LKK26 pKa = 9.93EE27 pKa = 3.62THH29 pKa = 5.57QEE31 pKa = 4.03KK32 pKa = 10.6KK33 pKa = 10.09PSQPSLSLLCSAPPPAVPSEE53 pKa = 4.08QASVGYY59 pKa = 10.0GIILARR65 pKa = 11.84TPTIFLQARR74 pKa = 11.84GAVYY78 pKa = 10.4SALPPPRR85 pKa = 11.84CRR87 pKa = 11.84ARR89 pKa = 11.84YY90 pKa = 8.6RR91 pKa = 11.84WTWHH95 pKa = 4.74QGRR98 pKa = 11.84KK99 pKa = 5.95KK100 pKa = 9.03TRR102 pKa = 11.84NNRR105 pKa = 11.84PTPQRR110 pKa = 11.84KK111 pKa = 8.37KK112 pKa = 8.11QQ113 pKa = 3.25
MM1 pKa = 7.4LVFHH5 pKa = 7.24PPLLILEE12 pKa = 4.69IAQTGSGSHH21 pKa = 6.35PRR23 pKa = 11.84DD24 pKa = 3.19LKK26 pKa = 9.93EE27 pKa = 3.62THH29 pKa = 5.57QEE31 pKa = 4.03KK32 pKa = 10.6KK33 pKa = 10.09PSQPSLSLLCSAPPPAVPSEE53 pKa = 4.08QASVGYY59 pKa = 10.0GIILARR65 pKa = 11.84TPTIFLQARR74 pKa = 11.84GAVYY78 pKa = 10.4SALPPPRR85 pKa = 11.84CRR87 pKa = 11.84ARR89 pKa = 11.84YY90 pKa = 8.6RR91 pKa = 11.84WTWHH95 pKa = 4.74QGRR98 pKa = 11.84KK99 pKa = 5.95KK100 pKa = 9.03TRR102 pKa = 11.84NNRR105 pKa = 11.84PTPQRR110 pKa = 11.84KK111 pKa = 8.37KK112 pKa = 8.11QQ113 pKa = 3.25
Molecular weight: 12.7 kDa
Isoelectric point according different methods:
Peptides (in silico digests for buttom-up proteomics)
Below you can find in silico digests of the whole proteome with Trypsin, Chymotrypsin, Trypsin+LysC, LysN, ArgC proteases suitable for different mass spec machines.| Try ESI |
 |
|---|
| ChTry ESI |
|
|---|
| ArgC ESI |
|
|---|
| LysN ESI |
|
|---|
| TryLysC ESI |
|
|---|
| Try MALDI |
|
|---|
| ChTry MALDI |
|
|---|
| ArgC MALDI |
|
|---|
| LysN MALDI |
|
|---|
| TryLysC MALDI |
|
|---|
| Try LTQ |
|
|---|
| ChTry LTQ |
|
|---|
| ArgC LTQ |
|
|---|
| LysN LTQ |
|
|---|
| TryLysC LTQ |
|
|---|
| Try MSlow |
|
|---|
| ChTry MSlow |
|
|---|
| ArgC MSlow |
|
|---|
| LysN MSlow |
|
|---|
| TryLysC MSlow |
|
|---|
| Try MShigh |
|
|---|
| ChTry MShigh |
|
|---|
| ArgC MShigh |
|
|---|
| LysN MShigh |
|
|---|
| TryLysC MShigh |
|
|---|
General Statistics
Number of major isoforms |
Number of additional isoforms |
Number of all proteins |
Number of amino acids |
Min. Seq. Length |
Max. Seq. Length |
Avg. Seq. Length |
Avg. Mol. Weight |
|---|---|---|---|---|---|---|---|
0 |
2402 |
44 |
606 |
300.3 |
33.42 |
Amino acid frequency
Ala |
Cys |
Asp |
Glu |
Phe |
Gly |
His |
Ile |
Lys |
Leu |
|---|---|---|---|---|---|---|---|---|---|
7.369 ± 0.702 | 2.456 ± 0.886 |
5.287 ± 0.465 | 5.995 ± 0.557 |
4.33 ± 0.523 | 7.286 ± 0.703 |
2.664 ± 0.31 | 4.08 ± 0.696 |
5.329 ± 0.783 | 9.7 ± 0.983 |
Met |
Asn |
Gln |
Pro |
Arg |
Ser |
Thr |
Val |
Trp |
Tyr |
|---|---|---|---|---|---|---|---|---|---|
1.291 ± 0.272 | 3.747 ± 0.619 |
5.912 ± 1.164 | 4.163 ± 0.387 |
5.953 ± 0.858 | 7.785 ± 0.846 |
6.744 ± 0.436 | 5.329 ± 0.413 |
1.499 ± 0.208 | 3.081 ± 0.384 |
Most of the basic statistics you can see at this page can be downloaded from this CSV file
See this proteome in:

Proteome-pI is available under Creative Commons Attribution-NoDerivs license, for more details see here
| Reference: Kozlowski LP. Proteome-pI 2.0: Proteome Isoelectric Point Database Update. Nucleic Acids Res. 2021, doi: 10.1093/nar/gkab944 | Contact: Lukasz P. Kozlowski |