Mucispirillum schaedleri ASF457
Taxonomy: cellular organisms; Bacteria; Deferribacteres; Deferribacteres; Deferribacterales; Deferribacteraceae; Mucispirillum; Mucispirillum schaedleri
Average proteome isoelectric point is 6.54
Get precalculated fractions of proteins
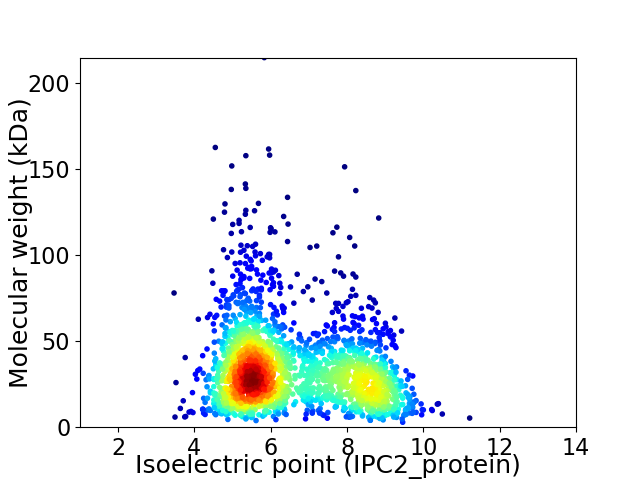
Virtual 2D-PAGE plot for 2091 proteins (isoelectric point calculated using IPC2_protein)
Get csv file with sequences according to given criteria:
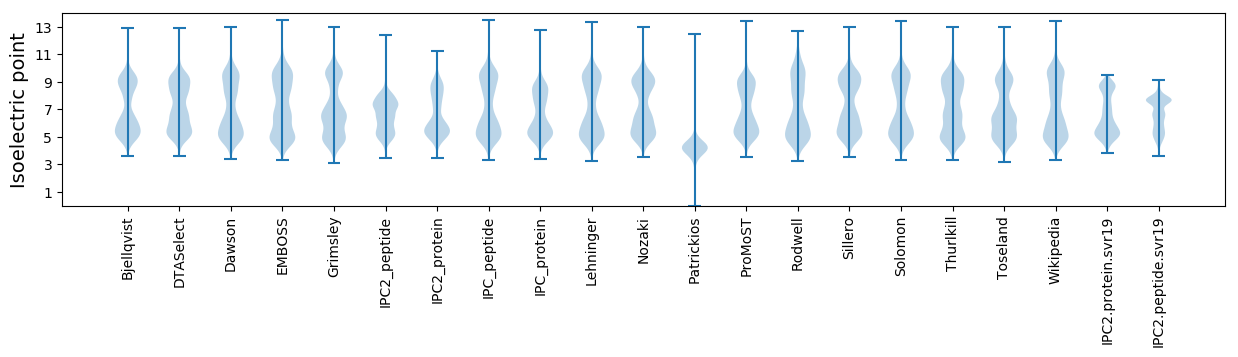
* You can choose from 21 different methods for calculating isoelectric point
Summary statistics related to proteome-wise predictions
Protein with the lowest isoelectric point:
>tr|V2QES8|V2QES8_9BACT Peptidyl-tRNA hydrolase OS=Mucispirillum schaedleri ASF457 OX=1379858 GN=pth PE=3 SV=1
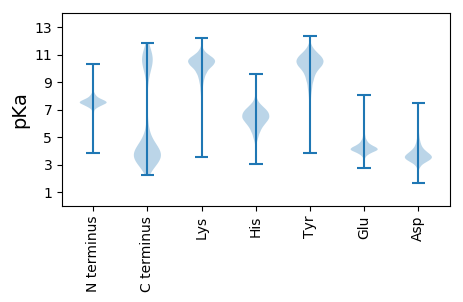
MM1 pKa = 7.53KK2 pKa = 10.23KK3 pKa = 10.16YY4 pKa = 10.46VCNVCGWIYY13 pKa = 10.96DD14 pKa = 3.83PAVGIPEE21 pKa = 5.02DD22 pKa = 4.86GIAPGTAFEE31 pKa = 5.32DD32 pKa = 5.04LPDD35 pKa = 4.08DD36 pKa = 4.24WVCPQCFVGKK46 pKa = 10.38DD47 pKa = 3.41EE48 pKa = 5.14FSPLEE53 pKa = 4.13DD54 pKa = 3.16
MM1 pKa = 7.53KK2 pKa = 10.23KK3 pKa = 10.16YY4 pKa = 10.46VCNVCGWIYY13 pKa = 10.96DD14 pKa = 3.83PAVGIPEE21 pKa = 5.02DD22 pKa = 4.86GIAPGTAFEE31 pKa = 5.32DD32 pKa = 5.04LPDD35 pKa = 4.08DD36 pKa = 4.24WVCPQCFVGKK46 pKa = 10.38DD47 pKa = 3.41EE48 pKa = 5.14FSPLEE53 pKa = 4.13DD54 pKa = 3.16
Molecular weight: 5.98 kDa
Isoelectric point according different methods:
Protein with the highest isoelectric point:
>tr|V2Q4Q2|V2Q4Q2_9BACT Uncharacterized protein (Fragment) OS=Mucispirillum schaedleri ASF457 OX=1379858 GN=N508_00067 PE=4 SV=1
MM1 pKa = 7.41AQLTLAKK8 pKa = 9.21RR9 pKa = 11.84TNLKK13 pKa = 10.01KK14 pKa = 10.36VRR16 pKa = 11.84KK17 pKa = 8.21QGFRR21 pKa = 11.84ARR23 pKa = 11.84MATKK27 pKa = 10.37GGRR30 pKa = 11.84LVIKK34 pKa = 10.33RR35 pKa = 11.84RR36 pKa = 11.84RR37 pKa = 11.84AKK39 pKa = 9.74GRR41 pKa = 11.84KK42 pKa = 8.66RR43 pKa = 11.84LAVV46 pKa = 3.41
MM1 pKa = 7.41AQLTLAKK8 pKa = 9.21RR9 pKa = 11.84TNLKK13 pKa = 10.01KK14 pKa = 10.36VRR16 pKa = 11.84KK17 pKa = 8.21QGFRR21 pKa = 11.84ARR23 pKa = 11.84MATKK27 pKa = 10.37GGRR30 pKa = 11.84LVIKK34 pKa = 10.33RR35 pKa = 11.84RR36 pKa = 11.84RR37 pKa = 11.84AKK39 pKa = 9.74GRR41 pKa = 11.84KK42 pKa = 8.66RR43 pKa = 11.84LAVV46 pKa = 3.41
Molecular weight: 5.32 kDa
Isoelectric point according different methods:
Peptides (in silico digests for buttom-up proteomics)
Below you can find in silico digests of the whole proteome with Trypsin, Chymotrypsin, Trypsin+LysC, LysN, ArgC proteases suitable for different mass spec machines.| Try ESI |
 |
|---|
| ChTry ESI |
|
|---|
| ArgC ESI |
|
|---|
| LysN ESI |
|
|---|
| TryLysC ESI |
|
|---|
| Try MALDI |
|
|---|
| ChTry MALDI |
|
|---|
| ArgC MALDI |
|
|---|
| LysN MALDI |
|
|---|
| TryLysC MALDI |
|
|---|
| Try LTQ |
|
|---|
| ChTry LTQ |
|
|---|
| ArgC LTQ |
|
|---|
| LysN LTQ |
|
|---|
| TryLysC LTQ |
|
|---|
| Try MSlow |
|
|---|
| ChTry MSlow |
|
|---|
| ArgC MSlow |
|
|---|
| LysN MSlow |
|
|---|
| TryLysC MSlow |
|
|---|
| Try MShigh |
|
|---|
| ChTry MShigh |
|
|---|
| ArgC MShigh |
|
|---|
| LysN MShigh |
|
|---|
| TryLysC MShigh |
|
|---|
General Statistics
Number of major isoforms |
Number of additional isoforms |
Number of all proteins |
Number of amino acids |
Min. Seq. Length |
Max. Seq. Length |
Avg. Seq. Length |
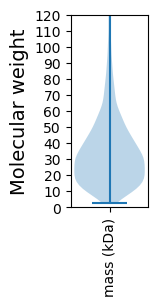
Avg. Mol. Weight |
|---|---|---|---|---|---|---|---|
0 |
665262 |
29 |
1922 |
318.2 |
35.85 |
Amino acid frequency
Ala |
Cys |
Asp |
Glu |
Phe |
Gly |
His |
Ile |
Lys |
Leu |
|---|---|---|---|---|---|---|---|---|---|
6.952 ± 0.063 | 1.112 ± 0.02 |
5.682 ± 0.04 | 6.554 ± 0.052 |
4.698 ± 0.045 | 5.996 ± 0.058 |
1.595 ± 0.022 | 9.305 ± 0.056 |
8.346 ± 0.063 | 8.667 ± 0.052 |
Met |
Asn |
Gln |
Pro |
Arg |
Ser |
Thr |
Val |
Trp |
Tyr |
|---|---|---|---|---|---|---|---|---|---|
2.711 ± 0.027 | 6.274 ± 0.063 |
2.972 ± 0.028 | 2.68 ± 0.029 |
3.302 ± 0.031 | 6.665 ± 0.039 |
5.086 ± 0.042 | 6.123 ± 0.043 |
0.639 ± 0.015 | 4.642 ± 0.05 |
Most of the basic statistics you can see at this page can be downloaded from this CSV file
See this proteome in:

Proteome-pI is available under Creative Commons Attribution-NoDerivs license, for more details see here
| Reference: Kozlowski LP. Proteome-pI 2.0: Proteome Isoelectric Point Database Update. Nucleic Acids Res. 2021, doi: 10.1093/nar/gkab944 | Contact: Lukasz P. Kozlowski |