American hop latent virus
Taxonomy: Viruses; Riboviria; Orthornavirae; Kitrinoviricota; Alsuviricetes; Tymovirales; Betaflexiviridae; Quinvirinae; Carlavirus
Average proteome isoelectric point is 7.07
Get precalculated fractions of proteins
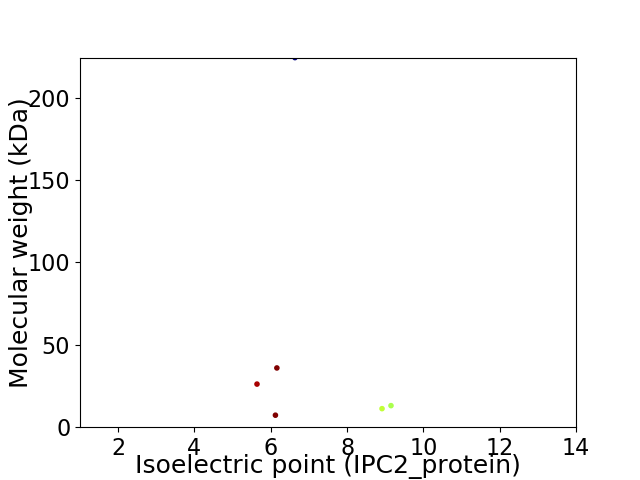
Virtual 2D-PAGE plot for 6 proteins (isoelectric point calculated using IPC2_protein)
Get csv file with sequences according to given criteria:
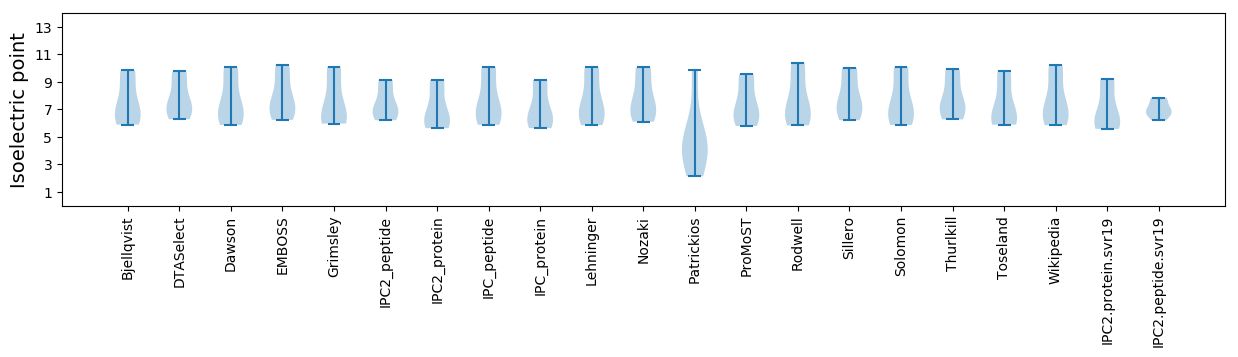
* You can choose from 21 different methods for calculating isoelectric point
Summary statistics related to proteome-wise predictions
Protein with the lowest isoelectric point:
>tr|I1W5T4|I1W5T4_9VIRU Movement protein TGB2 OS=American hop latent virus OX=1177630 PE=3 SV=1
MM1 pKa = 7.61EE2 pKa = 5.0IVLEE6 pKa = 4.03IAEE9 pKa = 4.28KK10 pKa = 10.33FGFVRR15 pKa = 11.84VSNKK19 pKa = 9.71LSKK22 pKa = 10.4PLVFHH27 pKa = 6.58CVPGAGKK34 pKa = 10.35SSLIRR39 pKa = 11.84EE40 pKa = 4.59LLNASDD46 pKa = 4.2GFRR49 pKa = 11.84AYY51 pKa = 9.68TFGACDD57 pKa = 3.35RR58 pKa = 11.84VNLSGKK64 pKa = 8.78YY65 pKa = 8.82IRR67 pKa = 11.84RR68 pKa = 11.84APWSDD73 pKa = 2.93SDD75 pKa = 4.22ILGKK79 pKa = 10.6LLLVDD84 pKa = 5.22EE85 pKa = 4.59YY86 pKa = 11.54TEE88 pKa = 4.36GTFDD92 pKa = 4.34LSIAFAVFGDD102 pKa = 4.17PLQSTRR108 pKa = 11.84DD109 pKa = 3.83NFCTPHH115 pKa = 5.53FTCHH119 pKa = 6.0LSRR122 pKa = 11.84RR123 pKa = 11.84FGQKK127 pKa = 7.99TASLLRR133 pKa = 11.84LLGYY137 pKa = 10.19QIEE140 pKa = 4.57STKK143 pKa = 10.85EE144 pKa = 3.74DD145 pKa = 3.24VVLIEE150 pKa = 6.09DD151 pKa = 4.13IFKK154 pKa = 10.53ADD156 pKa = 4.21PIGEE160 pKa = 4.09IVCYY164 pKa = 10.14EE165 pKa = 3.92KK166 pKa = 10.66EE167 pKa = 4.11IYY169 pKa = 10.42NLLCAHH175 pKa = 6.33CVEE178 pKa = 5.37FKK180 pKa = 10.7TPDD183 pKa = 3.71EE184 pKa = 4.04IRR186 pKa = 11.84GATFKK191 pKa = 11.05NVTFITASSEE201 pKa = 4.16PVDD204 pKa = 3.84SKK206 pKa = 11.74AAFICLTRR214 pKa = 11.84HH215 pKa = 4.77TEE217 pKa = 3.89KK218 pKa = 11.06LQILCPDD225 pKa = 3.39ASFAPSQLHH234 pKa = 5.57
MM1 pKa = 7.61EE2 pKa = 5.0IVLEE6 pKa = 4.03IAEE9 pKa = 4.28KK10 pKa = 10.33FGFVRR15 pKa = 11.84VSNKK19 pKa = 9.71LSKK22 pKa = 10.4PLVFHH27 pKa = 6.58CVPGAGKK34 pKa = 10.35SSLIRR39 pKa = 11.84EE40 pKa = 4.59LLNASDD46 pKa = 4.2GFRR49 pKa = 11.84AYY51 pKa = 9.68TFGACDD57 pKa = 3.35RR58 pKa = 11.84VNLSGKK64 pKa = 8.78YY65 pKa = 8.82IRR67 pKa = 11.84RR68 pKa = 11.84APWSDD73 pKa = 2.93SDD75 pKa = 4.22ILGKK79 pKa = 10.6LLLVDD84 pKa = 5.22EE85 pKa = 4.59YY86 pKa = 11.54TEE88 pKa = 4.36GTFDD92 pKa = 4.34LSIAFAVFGDD102 pKa = 4.17PLQSTRR108 pKa = 11.84DD109 pKa = 3.83NFCTPHH115 pKa = 5.53FTCHH119 pKa = 6.0LSRR122 pKa = 11.84RR123 pKa = 11.84FGQKK127 pKa = 7.99TASLLRR133 pKa = 11.84LLGYY137 pKa = 10.19QIEE140 pKa = 4.57STKK143 pKa = 10.85EE144 pKa = 3.74DD145 pKa = 3.24VVLIEE150 pKa = 6.09DD151 pKa = 4.13IFKK154 pKa = 10.53ADD156 pKa = 4.21PIGEE160 pKa = 4.09IVCYY164 pKa = 10.14EE165 pKa = 3.92KK166 pKa = 10.66EE167 pKa = 4.11IYY169 pKa = 10.42NLLCAHH175 pKa = 6.33CVEE178 pKa = 5.37FKK180 pKa = 10.7TPDD183 pKa = 3.71EE184 pKa = 4.04IRR186 pKa = 11.84GATFKK191 pKa = 11.05NVTFITASSEE201 pKa = 4.16PVDD204 pKa = 3.84SKK206 pKa = 11.74AAFICLTRR214 pKa = 11.84HH215 pKa = 4.77TEE217 pKa = 3.89KK218 pKa = 11.06LQILCPDD225 pKa = 3.39ASFAPSQLHH234 pKa = 5.57
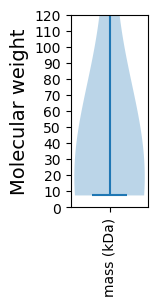
Molecular weight: 26.17 kDa
Isoelectric point according different methods:
Protein with the highest isoelectric point:
>tr|I1W5T7|I1W5T7_9VIRU RNA silencing suppressor OS=American hop latent virus OX=1177630 PE=3 SV=1
MM1 pKa = 7.48KK2 pKa = 10.14GARR5 pKa = 11.84LATLCLVFNKK15 pKa = 10.57LCGTYY20 pKa = 10.92VMPVCIDD27 pKa = 3.52IIKK30 pKa = 10.37RR31 pKa = 11.84SRR33 pKa = 11.84APLLTNGTSKK43 pKa = 10.08YY44 pKa = 10.04ARR46 pKa = 11.84RR47 pKa = 11.84RR48 pKa = 11.84RR49 pKa = 11.84AKK51 pKa = 9.96SVCRR55 pKa = 11.84CEE57 pKa = 3.19RR58 pKa = 11.84CYY60 pKa = 10.7RR61 pKa = 11.84VFPPLRR67 pKa = 11.84NSKK70 pKa = 10.3CDD72 pKa = 3.43NKK74 pKa = 9.78TCKK77 pKa = 9.96PGISYY82 pKa = 10.7RR83 pKa = 11.84EE84 pKa = 4.2DD85 pKa = 2.91IKK87 pKa = 11.23EE88 pKa = 3.95YY89 pKa = 10.15ILWGVTEE96 pKa = 5.21VIPQPGNCFSCRR108 pKa = 11.84KK109 pKa = 9.11NLNNII114 pKa = 3.52
MM1 pKa = 7.48KK2 pKa = 10.14GARR5 pKa = 11.84LATLCLVFNKK15 pKa = 10.57LCGTYY20 pKa = 10.92VMPVCIDD27 pKa = 3.52IIKK30 pKa = 10.37RR31 pKa = 11.84SRR33 pKa = 11.84APLLTNGTSKK43 pKa = 10.08YY44 pKa = 10.04ARR46 pKa = 11.84RR47 pKa = 11.84RR48 pKa = 11.84RR49 pKa = 11.84AKK51 pKa = 9.96SVCRR55 pKa = 11.84CEE57 pKa = 3.19RR58 pKa = 11.84CYY60 pKa = 10.7RR61 pKa = 11.84VFPPLRR67 pKa = 11.84NSKK70 pKa = 10.3CDD72 pKa = 3.43NKK74 pKa = 9.78TCKK77 pKa = 9.96PGISYY82 pKa = 10.7RR83 pKa = 11.84EE84 pKa = 4.2DD85 pKa = 2.91IKK87 pKa = 11.23EE88 pKa = 3.95YY89 pKa = 10.15ILWGVTEE96 pKa = 5.21VIPQPGNCFSCRR108 pKa = 11.84KK109 pKa = 9.11NLNNII114 pKa = 3.52
Molecular weight: 13.09 kDa
Isoelectric point according different methods:
Peptides (in silico digests for buttom-up proteomics)
Below you can find in silico digests of the whole proteome with Trypsin, Chymotrypsin, Trypsin+LysC, LysN, ArgC proteases suitable for different mass spec machines.| Try ESI |
 |
|---|
| ChTry ESI |
|
|---|
| ArgC ESI |
|
|---|
| LysN ESI |
|
|---|
| TryLysC ESI |
|
|---|
| Try MALDI |
|
|---|
| ChTry MALDI |
|
|---|
| ArgC MALDI |
|
|---|
| LysN MALDI |
|
|---|
| TryLysC MALDI |
|
|---|
| Try LTQ |
|
|---|
| ChTry LTQ |
|
|---|
| ArgC LTQ |
|
|---|
| LysN LTQ |
|
|---|
| TryLysC LTQ |
|
|---|
| Try MSlow |
|
|---|
| ChTry MSlow |
|
|---|
| ArgC MSlow |
|
|---|
| LysN MSlow |
|
|---|
| TryLysC MSlow |
|
|---|
| Try MShigh |
|
|---|
| ChTry MShigh |
|
|---|
| ArgC MShigh |
|
|---|
| LysN MShigh |
|
|---|
| TryLysC MShigh |
|
|---|
General Statistics
Number of major isoforms |
Number of additional isoforms |
Number of all proteins |
Number of amino acids |
Min. Seq. Length |
Max. Seq. Length |
Avg. Seq. Length |
Avg. Mol. Weight |
|---|---|---|---|---|---|---|---|
0 |
2820 |
66 |
1977 |
470.0 |
53.02 |
Amino acid frequency
Ala |
Cys |
Asp |
Glu |
Phe |
Gly |
His |
Ile |
Lys |
Leu |
|---|---|---|---|---|---|---|---|---|---|
7.376 ± 0.578 | 3.05 ± 0.739 |
4.929 ± 0.59 | 7.234 ± 0.989 |
4.965 ± 0.639 | 5.922 ± 0.461 |
2.34 ± 0.389 | 5.638 ± 0.332 |
6.454 ± 1.103 | 9.716 ± 0.712 |
Met |
Asn |
Gln |
Pro |
Arg |
Ser |
Thr |
Val |
Trp |
Tyr |
|---|---|---|---|---|---|---|---|---|---|
1.879 ± 0.281 | 4.326 ± 0.426 |
4.574 ± 1.299 | 2.553 ± 0.336 |
6.241 ± 0.695 | 6.773 ± 1.144 |
4.645 ± 0.547 | 6.915 ± 0.494 |
0.957 ± 0.204 | 3.511 ± 0.339 |
Most of the basic statistics you can see at this page can be downloaded from this CSV file
See this proteome in:

Proteome-pI is available under Creative Commons Attribution-NoDerivs license, for more details see here
| Reference: Kozlowski LP. Proteome-pI 2.0: Proteome Isoelectric Point Database Update. Nucleic Acids Res. 2021, doi: 10.1093/nar/gkab944 | Contact: Lukasz P. Kozlowski |